
Page 360 - Battery Reference Book
P. 360
Capacity returned (discharged capacity)-terminal voltage curves 3119
>
.- 100 110
c
0
n 90
m 100
0 80
-
a,
Q 70 td .-
> 90
3 60
E 80
U 50 m
5
.-
b 40 2 - 70
3
r 30 c 60
al
m 20 -
0
c 70 p 50
al
E F40
a -10 0 10 20 30 40 50 a
W
Ambient temperature ("C) 30
Figure 31.17 Percentage of withdrawable capacity at different 2o v.
temperatures for three load examples. Upper edge of cuwe:
charging at 2WC, discharging at quoted 'temperature. Lower edge
of curve: charging and discharging at quoted temperature (Dryfit
low-maintenance lead-acid batteries) (Courtesy of Dryfit)
Temperature ("C)
in Figure 31.17. To prevent permanent damage to the Figure 31.19 Capacity vemus temperature at various rates of
capacity behaviour of the batteries at very low tem- discharge. Eagle Picher Carefree rechargeable lead-acid battery
peratures, the shaded areas in Figure 31.17 should be (Courtesy of Eagle Picher)
avoided. Permanent use at extremely high tempera-
tures adversely affects the life of all types of battery, 10r
although for a few hours there is no objection to an
ambient temperature up to a maximum of 80°C. For
longer periods, allowance must be made for the cumu-
lative permanent loss of capacity. Permanent use at
temperatures above 50°C should be avoided.
Figure 31.18 shows a curve of percentage available
capacity versus temperature for a low-maintenance I I I I I I I I
partially recombining lead-acid battery. This battery -20 -10 0 10 20 30 40 50
functions satisfactorily over a wide range of service Temperature E"C)
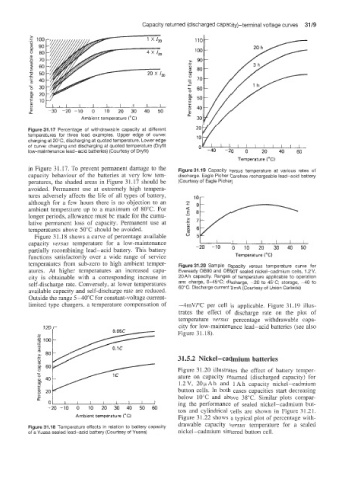
temperatures from sub-zero to high ambient temper- Figure 31.20 Sample capacity versus temperature curve for
atures. At higher temperatures an increased capa- Eveready OB90 and OB90T sealed nickel-cadmium cells, 12V,
city is obtainable with a corresponding increase in 20A h capacity. Ranges of temperature applicable to operation
self-discharge rate. Conversely. at lower temperatures are: charge, 0-45°C; discharge, -20 to 45'C; storage, -40 to
available capacity and self-discharge rate are reduced. 60°C. Discharge current 9 mA (Courtesy of Union Carbide)
Outside the range 5-40°C for constant-voltage current-
limited type chargers, a temperature compensation of -4mV/"C per cell is applicable. Figure 31.19 illus-
trates the effect of discharge rate on the plot of
iu '20 1 0.05C temperature versus percentage withdrawable capa-
city for low-maintenance lead-acid batteries (see also
9 100 /--E=== Figure 3 1.18).
31.5.2 Nickel-cadmium batteries
--
Figure 3 1.20 illustrates the effect of battery temper-
ature on capacity returned (discharged capacity) for
1.2 V, 20 FA h and 1 Ah capacity nickel-cadmium
hj, button cells. In both cases capacities start decreasing
below 10°C and above 38°C. Similar plots compar-
0 ing the performance of sealed nickel-cadmium but-
-20 -10 0 10 20 30 40 50 60 ton and cylindrical cells are shown in Figure 31.21.
Ambient temperature ("C) Figure 31.22 shows a typical plot of percentage with-
Figure 31.18 Temperature effects in relation to battery capacity drawable capacity versus temperature for a sealed
of a Yuasa sealed lead-acid battery (Courtesy of Yuasa) nickel-cadmium sintered button cell.