
Page 362 - Battery Reference Book
P. 362
Capacity returned (discharged capacity)-terminal voltage curves 31/11
1.4
3
- 1.2
-
8
- & 1.0
.-
SI 25 A 2.5 A 0.25 A 0
0.8
>
S
- I 0.6
.E E 0.51 0 150 300 450 600 750 900
Capacity (mA h)
I 1 I
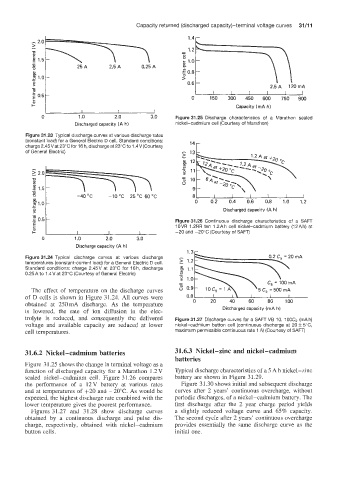
0 1 .o 2 .o 3.0 Figure 31.25 Discharge characteristics of a Marathon sealed
Discharged capacity (A h) nickel-cadmium cell (Courtesy of Marathon)
Figure 31.23 Typical discharge curves at various discharge rates
(constant load) for a General Electric D cell. Standard conditions: l4 r
charge2.45Vat 23"Cfor 16 h, dischargeat 23"Cto 1.4V(Courtesy
of General Electric) 13
- 12
2 2.0 11
0 10
2
- .E 1.5 9
al
0 -40 "C -1OOC 25 'C 60 "C I I I I I I
- 0 0.2 0.4 0.6 0.8 1.0 1.2
- 51.0
S Discharged capacity (A h)
Figure 31.26 Continuous discharge characteristics of a SAFT
IOVR 1.2RR ten 1.2Ah cell nickel-cadmium battery (12Ah) at
+20 and -20°C (Courtesy of SAFT)
Discharge capacity (A h)
Figure 31.24 Typical discharge curves at various discharge
temperatures (constant-current load) for a General Electric D cell.
Standard conditions: charge 2.45V at 23'C for 16h, discharge
0.25A to 1.4V at 23°C (Courtesy of General Electric)
The effect of temperature on the discharge curves
of D cells is shown in Figure 31.24. All curves were 0.8 I I I\ I I I
obtained at 250mA discharge. As the temperature 0 20 40 60 80 100
is lowered, the rate of ion diffusion in the elec- Discharged capacity (rnA h)
trolyte is reduced, and consequently the delivered Figure 31.27 Discharge curves for a SAFT VB 10, 1 OOCs (mA h)
voltage and available capacity are reduced at lower nickel-cadmium button cell (continuous discharge at 20 & 5%
cell temperatures. maximum permissible continuous rate 1 A) (Courtesy of SAFT)
31.6.2 Nickel-cadmium batteries 31.6.3 Nickel-zinc and nickel-cadmium
batteries
Figure 31.25 shows the change in terminal voltage as a
function of discharged capacity for a Marathon 1.2 V Typical discharge characteristics of a 5 Ah nickel-zinc
sealed nickel-cadmium cell. Figure 3 1.26 compares battery are shown in Figure 31.29.
the performance of a 12V batltery at various rates Figure 31.30 shows initial and subsequent discharge
and at temperatures of +20 and -20°C. As would be curves after 2 years' continuous overcharge, without
expected, the highest discharge rate combined with the periodic discharges, of a nickel-cadmium battery. The
lower temperature gives the poorest performance. first discharge after the 2 year charge period yields
Figures 31.27 and 31.28 show discharge curves a slightly reduced voltage curve and 65% capacity.
obtained by a continuous discharge and pulse dis- The second cycle after 2 years' continuous overcharge
charge, respectively, obtained with nickel-cadmium provides essentially the same discharge curve as the
button cells. initial one.