
Page 363 - Battery Reference Book
P. 363
31/12 Secondary batteries
.....,.................
I
I
0.1 0.2 0.5 1
0.1 0.2 0.5 1 2 2 5 10 20 50 100 500 1.2 -
500
5 10 20 50 100
L 2c
Pulse duration (5) I I I I I
0 25 50 75 100 125
Figure 31.28 Discharge curves for a SAFT VB 10, 1 DOCS (mA h) Rated capacity (%)
nickel-cadmium button cell (pulse discharge at 20 f YC, 100%
charged, maximum power for a 0.3s pulse = 7 W, maximum (a)
permissible pulse rate = 11 A). The voltages shown are the max-
imum cell voltage for a pulse discharge of a given current and
duration (Courtesy of SAFTj
1.8r
38 OC
27 "C
" 25 A at 26 "C 1.2L '"-28 "C
0 1.3 f
' 1.2 I i I I I
0 25 50 75 100 125
Rated capacity (%)
0 1 2 3 4 5 6
Capacity (Ah) (b)
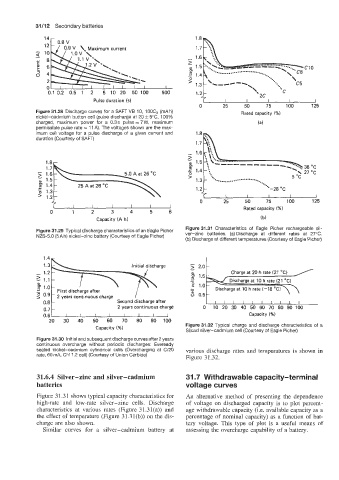
Figure 31.29 Typical discharge characteristics of an Eagle Picher Figure 31.31 Characteristics of Eagle Picher rechargeable sil-
NZS-5.0 (5A h) nickel-zinc battery (Courtesy of Eagle Picher) ver-zinc batteries. (a) Discharge at different rates at 27°C.
(b) Discharge at different temperatures (Courtesy of Eagle Picher)
1.4~
Initial discharge
P 1.0
c First discharge after
d 0.5
0.8 Second discharge after
2 years continuous charge 0 10 20 30 40 50 60 70 80 90 100
0.7
0.6 I I I I I I I J Capacity (%)
20 30 40 50 60 70 80 90 100
Capacity (%) Figure 31.32 Typical charge and discharge characteristics of a
Silcad silver-cadmium cell (Courtesy of Eagle Picher)
Figure 31.30 Initial and subsequent discharge curves after2 years
continuous overcharge without periodic discharges: Eveready
sealed nickel-cadmium cylindrical cells (Overcharging at C/20 various discharge rates and temperatures is shown in
rate, 60 mA, CH 1.2 cell) (Courtesy of Union Carbide) Figure 31.32.
31.6.4 Silver-zinc and silver-cadmium 31.7 Withdrawable capacity-terminal
batteries voltage curves
Figure 3 1.3 1 shows typical capacity characteristics for An alternative method of presenting the dependence
high-rate and low-rate silver-zinc cells. Discharge of voltage on discharged capacity is to plot percent-
characteristics at various rates (Figure 31.31(a)) and age withdrawable capacity (Le. available capacity as a
the effect of temperature (Figure 31.31(b)) on the dis- percentage of nominal capacity) as a function of bat-
charge are also shown. tery voltage. This type of plot is a useful means of
Similar curves for a silver-cadmium battery at assessing the overcharge capability of a battery.