
Page 359 - Battery Reference Book
P. 359
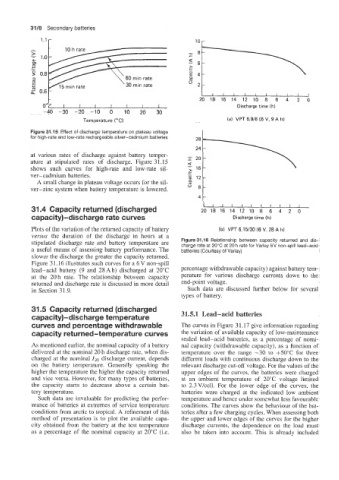
3118  Secondary batteries


                                      60 min rate
                                      30 min rate
                                                             I  l  l  l  l   l  l  l  l  l  l
                                                            20  18  16  14  12  10  8   6   4   2   0
                                      I    I    I                      Discharge time (h)
              -40  -30   -20   -10   0   10   20   30
                          Temperature ("C)                          (a)  VPT 6.9/8  (6 V,  9 A h)
          Figure 31.15  Effect of discharge temperature on plateau voltage
          for high-rate and low-rate rechargeable silver-cadmium  batteries

          at  various  rates  of  discharge against battery  temper-
          ature  at  stipulated  rates  of  discharge.  Figure 31.15
          shows  such  curves  for  high-rate  and  low-rate  sil-
          ver-cadmium  batteries.                          :j/ ,   I   I   I   ,   I   ,  ,
            A small change in plateau voltage occurs for the sil-
          ver-zinc  system when battery temperature is lowered.
                                                            4
          31.4  Capacity returned (discharged               20  18  16  14  12  10  8   6   4   2   0
          capacity)-discharge rate curves                             Discharge time (h)

          Plots of the variation of the returned capacity of battery   (b) VPT 6.15/30 (6 V. 28 A h)
          versus  the  duration  of  the  discharge  in  hours  at  a
          stipulated discharge rate  and battery  temperature  are   Figure 31 .I6 Relationship between capacity  returned and  dis-
                                                      charge rate at 20°C at 20 h rate for Varley 6V non-spill lead-acid
          a useful means of  assessing battery performance. The   batteries (Courtesy of Varley)
          slower the discharge the greater the capacity returned.
          Figure 31.16 illustrates such curves for a 6V non-spill
          lead-acid  battery  (9  and  28 Ah) discharged at  20°C   percentage withdrawable capacity) against battery tem-
          at  the  20 h  rate.  The  relationship  between  capacity   perature  for  various  discharge  currents  down  to  the
          returned and discharge rate is discussed in more detail   end-point voltage.
          in Section 31.9.                              Such  data  are  discussed  further  below  for  several
                                                      types of battery.
          31.5  Capacity returned (discharged
          capacity)-discharge temperature             31.5.1  Lead-acid  batteries
          curves and percentage withdrawable          The curves in Figure 3 1.17 give information regarding
          capacity returned-temperature  curves       the variation of available capacity of low-maintenance
                                                      sealed lead-acid  batteries,  as  a percentage  of  nomi-
          As mentioned earlier, the nominal capacity of a battery   nal capacity (withdrawable capacity), as a function of
          delivered at the nominal 20 h discharge rate, when dis-   temperature  over the  range  -30  to  +50T  for three
          charged at the nominal Z20  discharge current, depends   different loads with continuous discharge down to the
          on  the  battery  temperature.  Generally  speaking  the   relevant discharge cut-off voltage. For the values of the
          higher the temperature the higher the capacity returned   upper edges of  the curves, the batteries were charged
          and vice versa. However, for many types of  batteries,   at  an  ambient  temperature  of  20°C  voltage  limited
          the  capacity  starts  to  decrease  above  a  certain  bat-   to  2.3Vkell.  For  the  lower  edge  of  the  curves,  the
          tery temperature.                           batteries  were  charged  at  the  indicated  low  ambient
            Such data  are invaluable for predicting the perfor-   temperature and hence under somewhat less favourable
          mance of  batteries at extremes of  service temperature   conditions. The curves show the behaviour of the bat-
          conditions from arctic to tropical. A refinement of this   teries after a few charging cycles. When assessing both
          method of  presentation  is to  plot  the  available capa-   the upper and lower edges of the curves for the higher
          city obtained from the battery at the test temperature   discharge currents, the  dependence on  the  load must
          as a percentage of  the nominal capacity at 20°C (i.e.   also be  taken  into  account. This  is  already included