
Page 357 - Battery Reference Book
P. 357
3116 Secondary batteries
Button cells
2 x 110
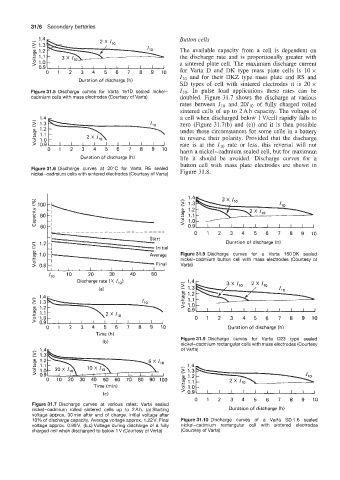
g) 1.2 The available capacity from a cell is dependent on
J 1.1 the discharge rate and is proportionally greater with
1.0 a sintered plate cell. The maximum discharge current
0.9
0 1 2 3 4 5 6 7 8 9 10 for Varta D and DK type mass plate cells is 10 x
110 and for their DKZ type mass plate and RS and
Duration of discharge Ih) SD types of cell with sintered electrodes it is 20 x
;::rx> rates between 110 and 20110 of fully charged rolled
Figure31.5 Discharge curves for Varta 151D sealed nickel- 110. In pulse load applications these rates can be
cadmium cells with mass electrodes (Courtesy of Varta) doubled. Figure 31.7 shows the discharge at various
sintered cells of up to 2Ah capacity. The voltage of
zero (Figure 31.7(b) and (c)) and it is then possible
1.2 a cell when discharged below 1 V/cell rapidly falls to
J 1.1 under these circumstances for some cells in a battery
0 1.0 2 x 110 to reverse their polarity. Provided that the discharge
' ti lo harmanickel-cadmiumsealedcell, butfor maximum
> 0.9 rate is at the I10 rate or less, this reversal will not
Duration of discharge (h) life it should be avoided. Discharge curves for a
Y
button cell with mass plate electrodes are shown in
Figure31.6 Discharge curves at 20'C for Varta RS sealed
nickel-cadmium cells with sintered electrodes (Courtesy of Varta) Figure 1.8.
1
z -
P 80-1
4 -1
60-,
__________----_---_-- --- 0 1 2 3 4 5 6 7 8 9 10
_I - - Start
- 1.0 -I - Initial Duration of discharge (h)
-
Figure 31.8 Discharge curves for a Varta 150 DK sealed
- -I
- Tverage
nickel-cadmium button cell with mass electrodes (Courtesy of
8 0.8 -I -Final Varta)
I , I , I I I I I I
I,, 10 20 30 40 50
Discharge rate (X I,,)
(a)
8 1.2 '0.9LI I I I I I I I I I
J 1.1
0 1 2 3 4 5 6 7 8 9 10
0 1 2 3 4 5 6 7 8 9 10 Duration of discharge (h)
Figure 31.9 Discharge curves for Varta D23 type sealed
nickel-cadmium rectangular cells with mass electrodes (Courtesy
of Varta)
0 10 20 30 40 50 60 70 80 90 100
10
0
Time (min)
IC)
0 1 2 3 4 5 6 7 8 9 10
Figure 31.7 Discharge curves at various rates: Varta sealed
nickel-cadmium rolled sintered cells up to 2Ah. (a) Starting Duration of discharge (h)
voltage approx. 30min after end of charge. Initial voltage after
10% of discharge capacity. Average voltage approx. 1.22V. Final Figure 31.10 Discharge curves of a Varta SD 1.6 sealed
voltage approx. 0.99V. (b,c) Voltage during discharge of a fully nickel-cadmium rectangular cell with sintered electrodes
charged cell when discharged to below 1 V (Courtesy of Varta) (Courtesy of Varta)