
Page 361 - Battery Reference Book
P. 361
31/10 Secondary batteries
llOr
1 I I I I I I ]
-20 -10 0 10 20 30 40 45
Temperature ("C)
(a) Button cells
llOr
-20 -10 0 10 20 30 40 45
Temperature ("C)
(b) Cylindrical cells
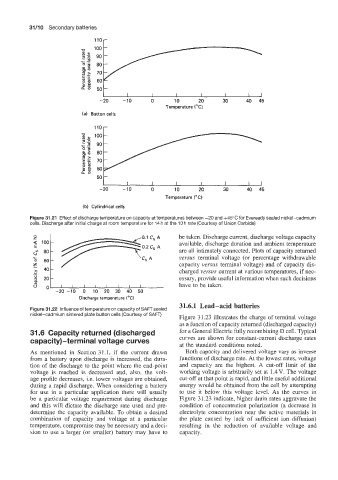
Figure 31.21 Effect of discharge temperature on capacity at temperatures between -20 and +45"C for Eveready sealed nickel-cadmium
cells. Discharge after initial charge at room temperature for 14 h at the 10 h rate (Courtesy of Union Carbide)
be taken. Discharge current, discharge voltage capacity
available, discharge duration and ambient temperature
are all intimately connected. Plots of capacity returned
versus terminal voltage (or percentage withdrawable
capacity versus terminal voltage) and of capacity dis-
charged versus current at various temperatures, if nec-
essary, provide useful information when such decisions
lb 20 30 do 5b have to be taken.
O' -20 -1;
Discharge temperature (TI
31.6.1 Lead-acid batteries
Figure 31.22 Influence of temperature on capacity of SAFT sealed
nickel-cadmium sintered plate button cells (Courtesy of SAFT)
Figure 31.23 illustrates the charge of terminal voltage
as a function of capacity returned (discharged capacity)
31.6 Capacity returned (discharged for a General Electric fully recombining D cell. Typical
capacity)-terminal voltage curves curves are shown for constant-current discharge rates
at the standard conditions noted.
As mentioned in Section 31.1, if the current drawn Both capacity and delivered voltage vary as inverse
from a battery upon discharge is increased, the dura- functions of discharge rate. At the lowest rates, voltage
tion of the discharge to the point where the end-point and capacity are the highest. A cut-off limit of the
voltage is reached is decreased and, also, the volt- working voltage is arbitrarily set at 1.4 V. The voltage
age profile decreases, i.e. lower voltages are obtained, cut-off at that point is rapid, and little useful additional
during a rapid discharge. When considering a battery energy would be obtained from the cell by attempting
for use in a particular application there will usually to use it below this voltage level. As the curves in
be a particular voltage requirement during discharge Figure 3 1.23 indicate, higher drain rates aggravate the
and this will dictate the discharge rate used and pre- condition of concentration polarization (a decrease in
determine the capacity available. To obtain a desired electrolyte concentration near the active materials in
combination of capacity and voltage at a particular the plate caused by lack of sufficient ion diffusion)
temperature, compromise may be necessary and a deci- resulting in the reduction of available voltage and
sion to use a larger (or smaller) battery may have to capacity.