
Page 364 - Battery Reference Book
P. 364
Discharge rate-capacity returned (discharged capacity) curves 31/13
31.8 Capalcity returned (discharged
capacity)-discharge current curves
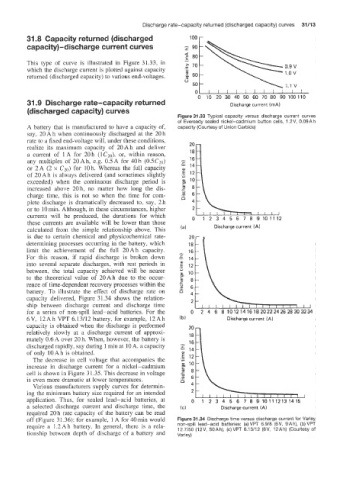
This type of curve is illustrated in Figure 31.33, in
which the discharge current is plotted against capacity
returned (discharged capacity) to various end-voltages.
v
50t \
1.1
01 1 1 1 I I I I I 1 1 1
0 10 20 30 40 50 60 70 80 90 100110
31.9 Dischtarge rate-capacity returned Discharge current ImA)
(discharged capacity) curves
Figure 31.33 Typical capacity versus discharge current curves
of Eveready sealed nickel-cadmium button cells, 1.2 V, 0.09A h
A battery that is manufactured to have a capacity of, capacity (Courtesy of Union Carbide)
say, 20Ah when continuously discharged at the 20h
rate to a fixed end-voltage will, under these conditions,
realize its maximum capacity of 20Ah and deliver
a current of 1 A for 20 h (ICzo), or, within reason,
any multiples of 20 Ah, e.g. 0.5 A for 40 h (0.5Czo)
or 2A (2 x CZO) for 10h. Whereas the full capacity
of 20Ah is always delivered (and sometimes slightly
exceeded) when the continuous discharge period is
increased above 20h, no matter how long the dis-
charge time, this is not so when the time for com-
plete discharge is dramatically decreased to, say, 2 h
or to 10 min. Although, in these circumstances, higher u
currents will be produced, the durations for which 9 10 11 12
these currents are available will be lower than those
calculated from the simple relationship above. This (a) Discharge current (A)
is due to certain chemical and physicochemical rate-
determining processes occurring in the battery, which 2oc I
18
limit the achievement of the full 20Ah capacity. - 16
For this reaso'n, if rapid discharge is broken down f. 14
into several separate discharges, with rest periods in .- E 12
between, the .total capacity achieved will be nearer Y
w 10
to the theoretical value of 20Ah due to the occur- c g8
rence of time-dependent recovery processes within the g 6
battery. To illustrate the effect of discharge rate on l i 4
capacity delivered, Figure 3 1.34 shows the relation- 2
ship between discharge current and discharge time
for a series of non-spill lead-acid batteries. For the 0
6V, 12Ah VPT 6.13/12 battery, for example, 12Ah (b) Discharge current (A)
capacity is obtained when the discharge is performed
relatively slowly at a discharge current of approxi-
mately 0.6 A over 20 h. When, however, the battery is
discharged rapidly, say during 1 min at 10 A> a capacity
of only lOAh is obtained.
The decrease in cell voltage that accompanies the
increase in discharge current for a nickel-cadmium
cell is shown in Figure 31.35. This decrease in voltage
is even more dramatic at lower temperatures.
Various manufacturers supply curves for determin-
ing the minimum battery size required for an intended
application. Thus, for sealed lead-acid batteries, at
a selected discharge current and discharge time, the (C) Discharge current (A)
required 20 h rate capacity of the battery can be read
off (Figure 31.36): for example, 1 A for 40min would Figure 31.34 Discharge time versus discharge current for Varley
require a 1.2Ah battery. In general, there is a rela- non-spill lead-acid batteries: (a) VPT 6.9/8 (6V, 9A h), (b) VPT
tionship between depth of discharge of a battery and 12.7/50 (12V, 50Ah), (c)VPT 6.13/12 (6V, 12Ah) (Courtesy of
Varley)