
Page 365 - Battery Reference Book
P. 365
31/14 Secondary batteries
- 120r
30% DOD
.- - 40 ,
g2ot I I , I , I
u
0 200 400 600 BOO 1000 1200 1400
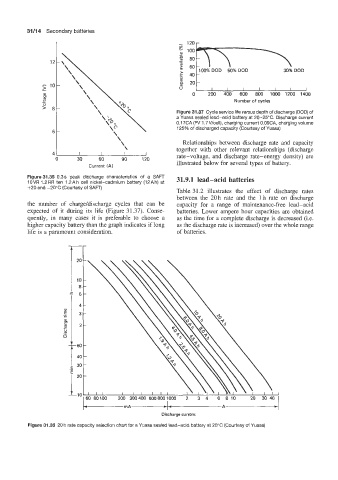
Number of cycles
Figure 31.37 Cycle service life versus depth of discharge (DOD) of
a Yuasa sealed lead-acid battery at 20-25°C. Discharge current
0.17CA (fV 1,7V/ceIl), charging current O.O9CA, charging volume
125% of discharged capacity (Courtesy of Yuasa)
Relationships between discharge rate and capacity
together with other relevant relationships (discharge
rate-voltage, and discharge rate-energy density) are
0 30 60 90 120 illustrated below for several types of battery.
Current (A)
Figure 31.35 0.3 s peak discharge characteristics of a SAFT 31.9.1 lead-acid batteries
IOVR 1.2RR ten 1.2Ah cell nickel-cadmium battery (12Ah) at
+20 and -20°C (Courtesy of SAFT)
Table 31.2 illustrates the effect of discharge rates
between the 20h rate and the 1 h rate on discharge
the number of charge/discharge cycles that can be capacity for a range of maintenance-free lead-acid
expected of it during its life (Figure 31.37). Conse- batteries. Lower ampere hour capacities are obtained
quently, in many cases it is preferable to choose a as the time for a complete discharge is decreased (Le.
higher capacity battery than the graph indicates if long as the discharge rate is increased) over the whole range
life is a paramount consideration. of batteries.
-r
Discharge currenr
Figure 31.36 20 h rate capacity selection chart for a Yuasa sealed lead-acid battery at 20°C (Courtesy of Yuasa)