
Page 366 - Battery Reference Book
P. 366
Discharge rate-energy density curves 31/15
Table 31.2 Discharge capacity of Yuasa maintenance-free
lead-acid batteries, at various discharge rates
Ly 1.2
Tvve Discharge capacity (A h) B 1.1 Average
20h 10h 5h 3h lh
rate rate rate rate rate Discharge rate (X I,o)
NP1.2-6 1.2 1.1 1.0 0.9 0.7 la)
NP2.6-6 2.6 2.4 2.2 2.0 1.6
NP4-6 4.0 3.7 3.4 3.1 2.4 - 1.4r
NP4.5-6 4.5 4.2 3.8 3.5 2.7
NP6-6 15.0 5.6 5.1 4.6 3.6
NP8-6 8.0 7.4 6.8 6.2 4.8
NP10-6 113.0 9.3 8.5 7.7 6.0 "."
NP1.9-12 1.9 1.8 1.6 1.5 1.1 0 2 4 6 8 10 12 14 16 98 20
NP2.6- 12 :2.6 2.4 2.2 2.0 1.6
NP6-12 6.0 5.6 5.1 4.6 3.6 Discharge rate (X I,,,)
NP20-i2 20.0 18.6 17.0 15.4 12.0 (b)
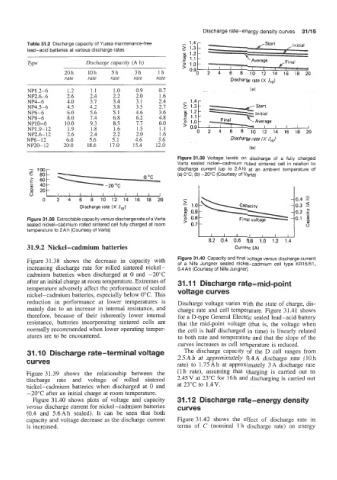
Figure31.39 Voltage levels on discharge of a fully charged
Varta sealed nickel-cadmium rolled sintered cell in relation to
discharge current (up to 2Ah) at an ambient temperature of
(a) 0°C; (b) -20°C (Courtesy of Varta)
0 OC
I I I I I I I I I
0 2 4 6 8 10 12 14 16 18 20
Discharge rate (X I,o) 0.2 .z
0.9
c
'
Figure 31.38 Extractable capacity versus discharge rate of aVarta 5 0.8 0.1
sealed nickel-cadmium rolled sintered cell fully charged at room 0.7
temperature to 2 Ah (Courtesy of Varta)
0.2 0.4 0.6 0.8 1.0 1.2 1.4
31.9.2 Nickel-cadmium baateries Current (A)
Figure 31.38 shows the decrease in capacity with Figure 31.40 Capacity and final voltage versus discharge current
of a Nife Jungner sealed nickel-cadmium cell type KR15/51,
increasing discharge rate for rolled sintered nickel- 0.4Ah (Courtesy of Nife Jungner)
cadmium batteries when discharged at 0 and -20°C
after an initial charge at room temperature. Extremes of 31 .I 1 Discharge rate-mid-point
temperature adversely affect the performance of sealed voltage curves
nickel-cadmium batteries, especially below 0°C. This
reduction in performance at lower temperatures is Discharge voltage varies with the state of charge, dis-
mainly due to an increase in internal resistance, and charge rate and cell temperature. Figure 31.41 shows
therefore, because of their inherently lower internal for a D-type General Electric sealed lead-acid battery
resistance, batteries incorporating sintered cells are that the mid-point voltge (that is, the voltage when
normally recommended when lower operating temper- the cell is half discharged in time) is linearly related
atures are to be encountered. to both rate and temperature and that the slope of the
curves increases as cell temperature is reduced.
The discharge capacity of the D cell ranges from
31 .IO Discharge rate-terminal voltage 2.5 Ah at approximately 0.4A discharge rate (10 h
cullles rate) to 1.75 Ah at approximately 3 A discharge rate
Figure 31.39 shows the relationship between the (1 h rate), assuming that charging is carried out to
discharge rate and voltage of rolled sintered 2.45 V at 23°C for 16 h and discharging is carried out
nickel-cadmium batteries when discharged at 0 and at 23°C to 1.4V.
-20°C after an initial charge at room temperature.
Figure 31.40 shows plots of voltage and capacity 31 .I 2 Discharge rate-energy density
versus discharge current for nickel-cadmium batteries curves
(0.4 and 5.6Ah sealed). It can be seen that both
capacity and vo'ltage decrease as the discharge current Figure 31.42 shows the effect of discharge rate in
is increased. terms of C (nominal 1 h discharge rate) on energy