
Page 357 - Between One and Many The Art and Science of Public Speaking
P. 357
324 Part 3 Putting Theory Into Practice
Exhibit 12.1 500
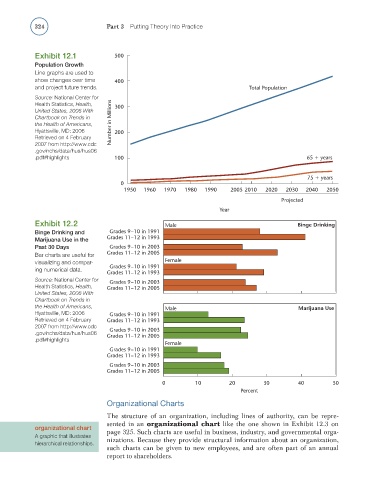
Population Growth
Line graphs are used to
show changes over time 400
and project future trends. Total Population
Source: National Center for
Health Statistics, Health, 300
United States, 2006 With
Chartbook on Trends in
the Health of Americans, Number in Millions
Hyattsville, MD: 2006 200
Retrieved on 4 February
2007 from http://www.cdc
.gov/nchs/data/hus/hus06
.pdf#highlights 100 65 years
75 years
0
1950 1960 1970 1980 1990 2005 2010 2020 2030 2040 2050
Projected
Year
Exhibit 12.2 Male Binge Drinking
Binge Drinking and Grades 9–10 in 1991
Marijuana Use in the Grades 11–12 in 1993
Past 30 Days Grades 9–10 in 2003
Bar charts are useful for Grades 11–12 in 2005
visualizing and compar- Female
Grades 9–10 in 1991
ing numerical data.
Grades 11–12 in 1993
Source: National Center for
Grades 9–10 in 2003
Health Statistics, Health, Grades 11–12 in 2005
United States, 2006 With
Chartbook on Trends in
the Health of Americans,
Male Marijuana Use
Hyattsville, MD: 2006 Grades 9–10 in 1991
Retrieved on 4 February Grades 11–12 in 1993
2007 from http://www.cdc
Grades 9–10 in 2003
.gov/nchs/data/hus/hus06
Grades 11–12 in 2005
.pdf#highlights
Female
Grades 9–10 in 1991
Grades 11–12 in 1993
Grades 9–10 in 2003
Grades 11–12 in 2005
0 10 20 30 40 50
Percent
Organizational Charts
The structure of an organization, including lines of authority, can be repre-
sented in an organizational chart like the one shown in Exhibit 12.3 on
organizational chart
page 325. Such charts are useful in business, industry, and governmental orga-
A graphic that illustrates
nizations. Because they provide structural information about an organization,
hierarchical relationships.
such charts can be given to new employees, and are often part of an annual
report to shareholders.