
Page 311 - Biaxial Multiaxial Fatigue and Fracture
P. 311
The Background of Fatigue Limit Ratio of Torsional Fatigue to Rotating Bending Fatigue in ... 295
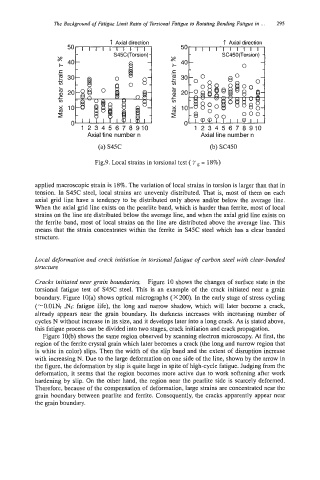
f Axial direction
50
x
r- 40
.-
c
2 30
.I-
u)
L
8 20
c
u)
3 10
r
0
12345678910 12345678910
Axial line number n Axial line number n
(a) S45C (b) SC450
Fig.9. Local strains in torsional test ( 7 = 18%)
applied macroscopic strain is 18%. The variation of local strains in torsion is larger than that in
tension. In S45C steel, local strains are unevenly distributed. That is, most of them on each
axial grid line have a tendency to be distributed only above andlor below the average line.
When the axial grid line exists on the pearlite band, which is harder than ferrite, most of local
strains on the line are distributed below the average line, and when the axial grid line exists on
the ferrite band, most of local strains on the line are distributed above the average line. This
means that the strain concentrates within the ferrite in S45C steel which has a clear banded
structure.
Local deformation and crack initiation in torsional fatigue of carbon steel with clear-banded
structure
Cracks initiated near grain boundaries. Figure 10 shows the changes of surface state in the
torsional fatigue test of S45C steel. This is an example of the crack initiated near a grain
boundary. Figure 1O(a) shows optical micrographs (X 200). In the early stage of stress cycling
(-0.01Nf ,Nf: fatigue life), the long and narrow shadow, which will later become a crack,
already appears near the grain boundary. Its darkness increases with increasing number of
cycles N without increase in its size, and it develops later into a long crack. As is stated above,
this fatigue process can be divided into two stages, crack initiation and crack propagation.
Figure lo@) shows the same region observed by scanning electron microscopy. At first, the
region of the ferrite crystal grain which later becomes a crack (the long and narrow region that
is white in color) slips. Then the width of the slip band and the extent of disruption increase
with increasing N. Due to the large deformation on one side of the line, shown by the arrow in
the figure, the deformation by slip is quite large in spite of high-cycle fatigue. Judging from the
deformation, it seems that the region becomes more active due to work softening after work
hardening by slip. On the other hand, the region near the pearlite side is scarcely deformed.
Therefore, because of the compensation of deformation, large strains are concentrated near the
grain boundary between pearlite and ferrite. Consequently, the cracks apparently appear near
the grain boundary.