
Page 309 - Biaxial Multiaxial Fatigue and Fracture
P. 309
The Background of Fatigue Limit Ratio of Torsional Fatigue to Rotating Bending Fatigue in ... 293
T Axial direction ? Axial direction
S45CVension)
c
.-
S 30
c
v)
9 20
c
v)
g 10
2
0
12345678910
Axial line number n Axial line number n
(a) S45C (b) SC450
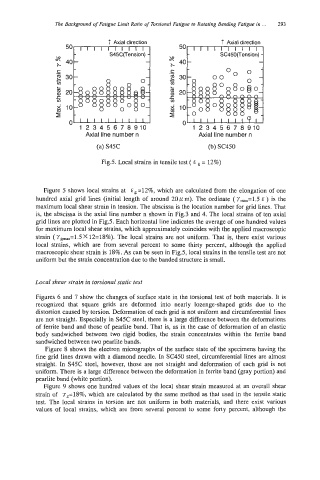
Fig5 Local strains in tensile test ( E = 12%)
Figure 5 shows local strains at Eg =12%, which are calculated from the elongation of one
hundred axial grid lines (initial length of around 2011 m). The ordinate (~,,,~~=1.5 E ) is the
maximum local shear strain in tension. The abscissa is the location number for grid lines. That
is, the abscissa is the axial line number n shown in Fig3 and 4. The local strains of ten axial
grid lines are plotted in Fig.5. Each horizontal line indicates the average of one hundred values
for maximum local shear strains, which approximately coincides with the applied macroscopic
strain (7,,=1.5 x 12=18%). The local strains are not uniform. That is, there exist various
local strains, which are from several percent to some thirty percent, although the applied
macroscopic shear strain is 18%. As can be seen in Fig.5, local strains in the tensile test are not
uniform but the strain concentration due to the banded structure is small.
Local shear strain in torsional static test
Figures 6 and 7 show the changes of surface state in the torsional test of both materials. It is
recognized that square grids are deformed into nearly lozenge-shaped grids due to the
distortion caused by torsion. Deformation of each grid is not uniform and circumferential lines
are not straight. Especially in S45C steel, there is a large difference between the deformations
of femte band and those of pearlite band. That is, as in the case of deformation of an elastic
body sandwiched between two rigid bodies, the strain concentrates within the ferrite band
sandwiched between two pearlite bands.
Figure 8 shows the electron micrographs of the surface state of the specimens having the
fine grid lines drawn with a diamond needle. In SC450 steel, circumferential lines are almost
straight. In S45C steel, however, those are not straight and deformation of each grid is not
uniform. There is a large difference between the deformation in ferrite band (gray portion) and
pearlite band (white portion).
Figure 9 shows one hundred values of the local shear strain measured at an overall shear
strain of rg=18%, which are calculated by the same method as that used in the tensile static
test. The local strains in torsion are not uniform in both materials, and there exist various
values of local strains, which are from several percent to some forty percent, although the