
Page 361 - Biaxial Multiaxial Fatigue and Fracture
P. 361
Three-Dimensional Crack Growth: Numerical Eualuations and Experimental Tests 345
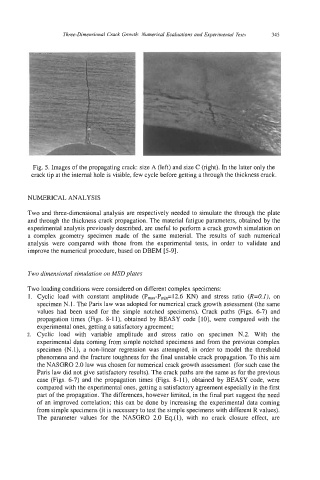
Fig. 5. Images of the propagating crack: size A (left) and size C (right). In the latter only the
crack tip at the internal hole is visible, few cycle before getting a through the thickness crack.
NUMERICAL ANALYSIS
Two and three-dimensional analysis are respectively needed to simulate the through the plate
and through the thickness crack propagation. The material fatigue parameters, obtained by the
experimental analysis previously described, are useful to perform a crack growth simulation on
a complex geometry specimen made of the same material. The results of such numerical
analysis were compared with those from the experimental tests, in order to validate and
improve the numerical procedure, based on DBEM [5-91.
Two dimensional simulation on MSD plates
-
Two loading conditions were considered on different complex specimens:
Cyclic load with constant amplitude (PmX-P~"=12.6 KN) and stress ratio (R=O.I), on
specimen N.l. The Paris law was adopted for numerical crack growth assessment (the same
values had been used for the simple notched specimens). Crack paths (Figs. 6-7) and
propagation times (Figs. 8-11), obtained by BEASY code [lo], were compared with the
experimental ones, getting a satisfactory agreement;
Cyclic load with variable amplitude and stress ratio on specimen N.2. With the
experimental data coming from simple notched specimens and from the previous complex
specimen (N.l), a non-linear regression was attempted, in order to model the threshold
phenomena and the fracture toughness for the final unstable crack propagation. To this aim
the NASGRO 2.0 law was chosen for numerical crack growth assessment (for such case the
Paris law did not give satisfactory results). The crack paths are the same as for the previous
case (Figs. 6-7) and the propagation times (Figs. 8-11), obtained by BEASY code, were
compared with the experimental ones, getting a satisfactory agreement especially in the first
part of the propagation. The differences, however limited, in the final part suggest the need
of an improved correlation; this can be done by increasing the experimental data coming
from simple specimens (it is necessary to test the simple specimens with different R values).
The parameter values for the NASGRO 2.0 Eq.(l), with no crack closure effect, are