
Page 359 - Biaxial Multiaxial Fatigue and Fracture
P. 359
Three-Dimensional Crack Growth: Numerical Evaluations and Experimental Tests 343
boundary conditions but, whenever out of tolerance deviations from the ideal rectilinear path
came out, the corresponding specimens were discarded from the analysis. In the final part of
crack propagation, due to high plasticity effects, a 45” deflection of the crack surface preceded
the ductile failure [3].
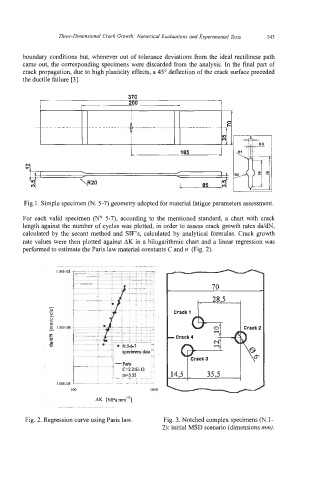
Fig. 1. Simple specimen (N. 5-7) geometry adopted for material fatigue parameters assessment.
For each valid specimen (N” 5-7), according to the mentioned standard, a chart with crack
length against the number of cycles was plotted, in order to assess crack growth rates da/dN,
calculated by the secant method and SIF’s, calculated by analytical formulas. Crack growth
rate values were then plotted against AK in a bilogarithmic chart and a linear regression was
performed to estimate the Paris law material constants C and n (Fig. 2).
7n
28,5
Crack 1 Crack 2
-
- Crack 4
Crack 3
353
I
Fig. 2. Regression curve using Paris law. Fig. 3. Notched complex specimens (N. 1 -
2): initial MSD scenario (dimensions mm).