
Page 166 - Big Data Analytics for Intelligent Healthcare Management
P. 166
6.3 OUR APPROACH 159
For this study, we used k-fold cross validation to evaluate our learning models. In this method, the
dataset is divided into k-fold and the model is repeated k times where in each repetition one fold is
used to test and the rest is used for training the model. We calculate the mean of this k performance
and present it in the results.
6.3.4 EXPERIMENTAL RESULTS
The adopted classifiers mainly arranged the datasets into two cognitive states and it followed two as-
sumptions: whether there is sufficient information to classify the cognitive states and if the machine
learning approach can effectively study the spatial-temporal patterns for classifying the states. Exper-
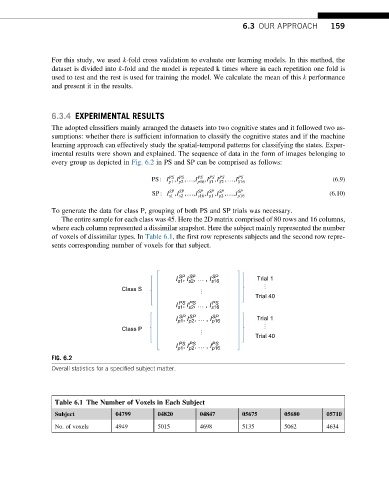
imental results were shown and explained. The sequence of data in the form of images belonging to
every group as depicted in Fig. 6.2 in PS and SP can be comprised as follows:
PS
PS
PS
PS
PS : I ,I ,…,I PS ,I ,I ,…,I PS (6.9)
p1 p2 p16 S1 S2 S16
SP
SP
SP
SP
SP
SP : I ,I ,…,I SP ,I ,I ,…,I p16 (6.10)
s16
p1
s2
s1
p2
To generate the data for class P, grouping of both PS and SP trials was necessary.
The entire sample for each class was 45. Here the 2D matrix comprised of 80 rows and 16 columns,
where each column represented a dissimilar snapshot. Here the subject mainly represented the number
of voxels of dissimilar types. In Table 6.1, the first row represents subjects and the second row repre-
sents corresponding number of voxels for that subject.
SP SP
I , I , ¼ , I SP Trial 1
s1 s2 s16
Class S ¼
¼
Trial 40
PS PS
PS
I , I , ¼ , I s16
s2
s1
SP SP
I , I , ¼ , I SP Trial 1
p1
p16
p2
¼
Class P
¼
Trial 40
PS PS PS
I , I , ¼ , I p16
p2
p1
FIG. 6.2
Overall statistics for a specified subject matter.
Table 6.1 The Number of Voxels in Each Subject
Subject 04799 04820 04847 05675 05680 05710
No. of voxels 4949 5015 4698 5135 5062 4634