
Page 171 - Big Data Analytics for Intelligent Healthcare Management
P. 171
164 CHAPTER 6 CLASSIFICATION FRAMEWORK OF fMRI DATA
SP SP SP
I , I , .... , I s16 Trial 1
s2
s1
Class S ¼ ¼
Trial 20
SP SP SP
I , I , .... , I s16
s1
s2
SP SP SP
I , I , .... , I p16 Trial 1
p1
p2
Class P ¼
¼
Trial 20
SP SP
I , I , .... , I SP
p16
p2
p1
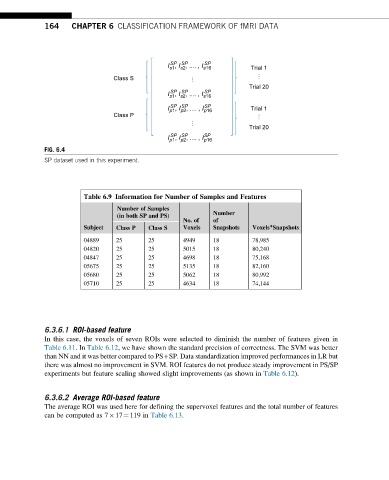
FIG. 6.4
SP dataset used in this experiment.
Table 6.9 Information for Number of Samples and Features
Number of Samples
Number
(in both SP and PS)
No. of of
Subject Class P Class S Voxels Snapshots Voxels*Snapshots
04889 25 25 4949 18 78,985
04820 25 25 5015 18 80,240
04847 25 25 4698 18 75,168
05675 25 25 5135 18 82,160
05680 25 25 5062 18 80,992
05710 25 25 4634 18 74,144
6.3.6.1 ROI-based feature
In this case, the voxels of seven ROIs were selected to diminish the number of features given in
Table 6.11.In Table 6.12, we have shown the standard precision of correctness. The SVM was better
than NN and it was better compared to PS+SP. Data standardization improved performances in LR but
there was almost no improvement in SVM. ROI features do not produce steady improvement in PS/SP
experiments but feature scaling showed slight improvements (as shown in Table 6.12).
6.3.6.2 Average ROI-based feature
The average ROI was used here for defining the supervoxel features and the total number of features
can be computed as 7 17¼119 in Table 6.13.