
Page 167 - Big Data Analytics for Intelligent Healthcare Management
P. 167
160 CHAPTER 6 CLASSIFICATION FRAMEWORK OF fMRI DATA
In the first experiment, the images were collected from PS and SP and pooled in PS+SP. In the
second experiment, we calculated PS and SP separately and the classification error was lower (0.50).
6.3.5 SUBJECT-DEPENDENT EXPERIMENTS ON PS+SP
We had 80 samples (40 samples per class), out of which 72 samples were used for training and 8 sam-
ples are used for testing in each repetition. In this paper, we conducted four feature selection methods.
6.3.5.1 All features
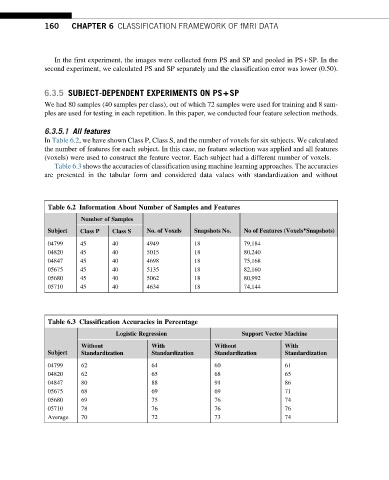
In Table 6.2, we have shown Class P, Class S, and the number of voxels for six subjects. We calculated
the number of features for each subject. In this case, no feature selection was applied and all features
(voxels) were used to construct the feature vector. Each subject had a different number of voxels.
Table 6.3 shows the accuracies of classification using machine learning approaches. The accuracies
are presented in the tabular form and considered data values with standardization and without
Table 6.2 Information About Number of Samples and Features
Number of Samples
Subject No. of Voxels Snapshots No. No of Features (Voxels*Snapshots)
Class P Class S
04799 45 40 4949 18 79,184
04820 45 40 5015 18 80,240
04847 45 40 4698 18 75,168
05675 45 40 5135 18 82,160
05680 45 40 5062 18 80,992
05710 45 40 4634 18 74,144
Table 6.3 Classification Accuracies in Percentage
Logistic Regression Support Vector Machine
Without With Without With
Subject
Standardization Standardization Standardization Standardization
04799 62 64 60 61
04820 62 65 68 65
04847 80 88 91 86
05675 68 69 69 71
05680 69 75 76 74
05710 78 76 76 76
Average 70 72 73 74