
Page 170 - Big Data Analytics for Intelligent Healthcare Management
P. 170
6.3 OUR APPROACH 163
Table 6.8 Classification Accuracies in Percentage
Logistic Regression Support Vector Machine
Without With Without With
Subject Standardization Standardization Standardization Standardization
04799 81 93 93 90
04820 82 89 85 84
04847 89 94 95 94
05675 86 96 97 96
05680 78 94 89 90
05710 81 88 88 85
Average 83 92 91 90
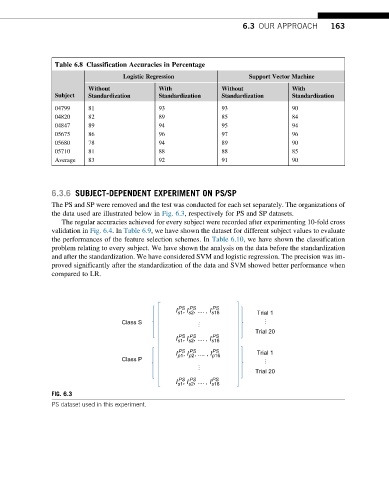
6.3.6 SUBJECT-DEPENDENT EXPERIMENT ON PS/SP
The PS and SP were removed and the test was conducted for each set separately. The organizations of
the data used are illustrated below in Fig. 6.3, respectively for PS and SP datasets.
The regular accuracies achieved for every subject were recorded after experimenting 10-fold cross
validation in Fig. 6.4.In Table 6.9, we have shown the dataset for different subject values to evaluate
the performances of the feature selection schemes. In Table 6.10, we have shown the classification
problem relating to every subject. We have shown the analysis on the data before the standardization
and after the standardization. We have considered SVM and logistic regression. The precision was im-
proved significantly after the standardization of the data and SVM showed better performance when
compared to LR.
PS PS PS
I , I , .... , I s16 Trial 1
s2
s1
Class S ¼ ¼
Trial 20
PS PS
PS
I , I , .... , I s16
s2
s1
PS PS
I , I , .... , I PS Trial 1
p16
p2
p1
Class P ¼
¼
Trial 20
PS PS
PS
I , I , .... , I s16
s2
s1
FIG. 6.3
PS dataset used in this experiment.