
Page 168 - Big Data Analytics for Intelligent Healthcare Management
P. 168
6.3 OUR APPROACH 161
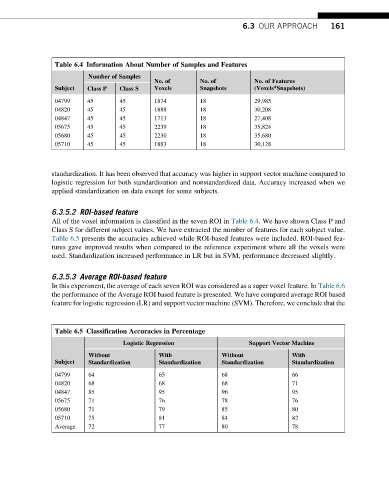
Table 6.4 Information About Number of Samples and Features
Number of Samples
No. of No. of No. of Features
Subject Class P Class S Voxels Snapshots (Voxels*Snapshots)
04799 45 45 1874 18 29,985
04820 45 45 1888 18 30,208
04847 45 45 1713 18 27,408
05675 45 45 2239 18 35,824
05680 45 45 2230 18 35,680
05710 45 45 1883 18 30,128
standardization. It has been observed that accuracy was higher in support vector machine compared to
logistic regression for both standardization and nonstandardized data. Accuracy increased when we
applied standardization on data except for some subjects.
6.3.5.2 ROI-based feature
All of the voxel information is classified in the seven ROI in Table 6.4. We have shown Class P and
Class S for different subject values. We have extracted the number of features for each subject value.
Table 6.5 presents the accuracies achieved while ROI-based features were included. ROI-based fea-
tures gave improved results when compared to the reference experiment where all the voxels were
used. Standardization increased performance in LR but in SVM, performance decreased slightly.
6.3.5.3 Average ROI-based feature
In this experiment, the average of each seven ROI was considered as a super voxel feature. In Table 6.6
the performance of the Average ROI based feature is presented. We have compared average ROI based
feature for logistic regression (LR) and support vector machine (SVM). Therefore, we conclude that the
Table 6.5 Classification Accuracies in Percentage
Logistic Regression Support Vector Machine
Without With Without With
Subject
Standardization Standardization Standardization Standardization
04799 64 65 68 66
04820 68 68 68 71
04847 85 95 96 95
05675 71 76 78 76
05680 71 79 85 80
05710 75 81 84 82
Average 72 77 80 78