
Page 169 - Big Data Analytics for Intelligent Healthcare Management
P. 169
162 CHAPTER 6 CLASSIFICATION FRAMEWORK OF fMRI DATA
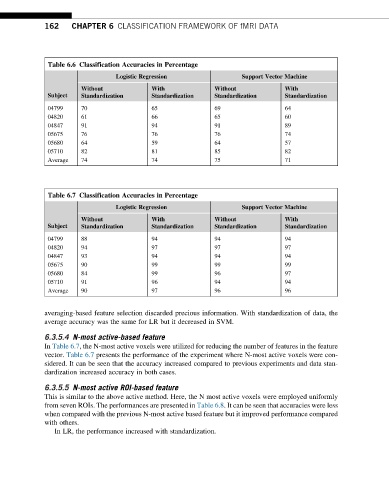
Table 6.6 Classification Accuracies in Percentage
Logistic Regression Support Vector Machine
Without With Without With
Subject Standardization Standardization Standardization Standardization
04799 70 65 69 64
04820 61 66 65 60
04847 91 94 91 89
05675 76 76 76 74
05680 64 59 64 57
05710 82 81 85 82
Average 74 74 75 71
Table 6.7 Classification Accuracies in Percentage
Logistic Regression Support Vector Machine
Without With Without With
Subject Standardization Standardization Standardization Standardization
04799 88 94 94 94
04820 94 97 97 97
04847 93 94 94 94
05675 90 99 99 99
05680 84 99 96 97
05710 91 96 94 94
Average 90 97 96 96
averaging-based feature selection discarded precious information. With standardization of data, the
average accuracy was the same for LR but it decreased in SVM.
6.3.5.4 N-most active-based feature
In Table 6.7, the N-most active voxels were utilized for reducing the number of features in the feature
vector. Table 6.7 presents the performance of the experiment where N-most active voxels were con-
sidered. It can be seen that the accuracy increased compared to previous experiments and data stan-
dardization increased accuracy in both cases.
6.3.5.5 N-most active ROI-based feature
This is similar to the above active method. Here, the N most active voxels were employed uniformly
from seven ROIs. The performances are presented in Table 6.8. It can be seen that accuracies were less
when compared with the previous N-most active based feature but it improved performance compared
with others.
In LR, the performance increased with standardization.