
Page 136 - Biodegradable Polyesters
P. 136
114 5 Crystallization of Poly(lactic acid)
Fraction of α-crystals on total crystal fraction 1 0
Crystal fraction
Mobile amorphous fraction
0.6
Crystalline, mobile and rigid amorphous fractions 0.4
Rigid amorphous fraction
0.2
80 100 120 140 160
Crystallization temperature (°C)
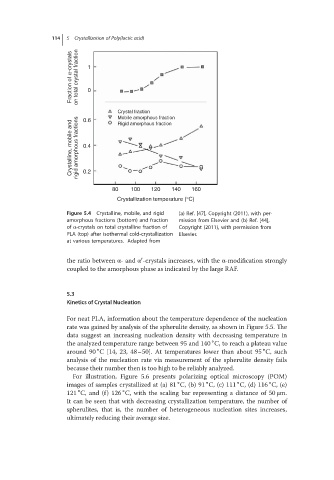
Figure 5.4 Crystalline, mobile, and rigid (a) Ref. [47], Copyright (2011), with per-
amorphous fractions (bottom) and fraction mission from Elsevier and (b) Ref. [44],
of α-crystals on total crystalline fraction of Copyright (2011), with permission from
PLA (top) after isothermal cold-crystallization Elsevier.
at various temperatures. Adapted from
′
the ratio between α-and α -crystals increases, with the α-modification strongly
coupled to the amorphous phase as indicated by the large RAF.
5.3
Kinetics of Crystal Nucleation
For neat PLA, information about the temperature dependence of the nucleation
rate was gained by analysis of the spherulite density, as shown in Figure 5.5. The
data suggest an increasing nucleation density with decreasing temperature in
∘
the analyzed temperature range between 95 and 140 C, to reach a plateau value
∘
∘
around 90 C [14, 23, 48–50]. At temperatures lower than about 95 C, such
analysis of the nucleation rate via measurement of the spherulite density fails
because their number then is too high to be reliably analyzed.
For illustration, Figure 5.6 presents polarizing optical microscopy (POM)
∘
∘
∘
∘
images of samples crystallized at (a) 81 C, (b) 91 C, (c) 111 C, (d) 116 C, (e)
∘
∘
121 C, and (f) 126 C, with the scaling bar representing a distance of 50 μm.
It can be seen that with decreasing crystallization temperature, the number of
spherulites, that is, the number of heterogeneous nucleation sites increases,
ultimately reducing their average size.