
Page 135 - Biodegradable Polyesters
P. 135
5.2 Crystal Polymorphism in Poly(L-lactic acid) 113
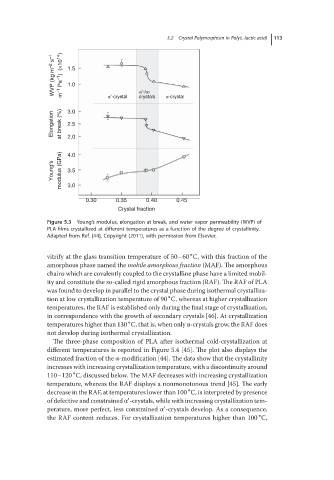
WVP (kg m –2 s –1 m –1 Pa –1 ) (×10 14 ) 1.5 α′-crystal crystals α-crystal
1.0
α′-/α-
Elongation at break (%) 3.0
2.5
2.0
Young‘s modulus (GPa) 4.0
3.5
3.0
0.30 0.35 0.40 0.45
Crystal fraction
Figure 5.3 Young’s modulus, elongation at break, and water vapor permeability (WVP) of
PLA films crystallized at different temperatures as a function of the degree of crystallinity.
Adapted from Ref. [44], Copyright (2011), with permission from Elsevier.
∘
vitrify at the glass transition temperature of 50–60 C, with this fraction of the
amorphous phase named the mobile amorphous fraction (MAF). The amorphous
chains which are covalently coupled to the crystalline phase have a limited mobil-
ity and constitute the so-called rigid amorphous fraction (RAF). The RAF of PLA
was found to develop in parallel to the crystal phase during isothermal crystalliza-
∘
tion at low crystallization temperature of 90 C, whereas at higher crystallization
temperatures, the RAF is established only during the final stage of crystallization,
in correspondence with the growth of secondary crystals [46]. At crystallization
∘
temperatures higher than 130 C, that is, when only α-crystals grow, the RAF does
not develop during isothermal crystallization.
The three-phase composition of PLA after isothermal cold-crystallization at
different temperatures is reported in Figure 5.4 [45]. The plot also displays the
estimated fraction of the α-modification [44]. The data show that the crystallinity
increases with increasing crystallization temperature, with a discontinuity around
∘
110–120 C, discussed below. The MAF decreases with increasing crystallization
temperature, whereas the RAF displays a nonmonotonous trend [45]. The early
∘
decrease in the RAF, at temperatures lower than 100 C, is interpreted by presence
′
of defective and constrained α -crystals, while with increasing crystallization tem-
′
perature, more perfect, less constrained α -crystals develop. As a consequence,
∘
the RAF content reduces. For crystallization temperatures higher than 100 C,