
Page 112 - Biofuels for a More Sustainable Future
P. 112
Indicators for sustainability assessment 99
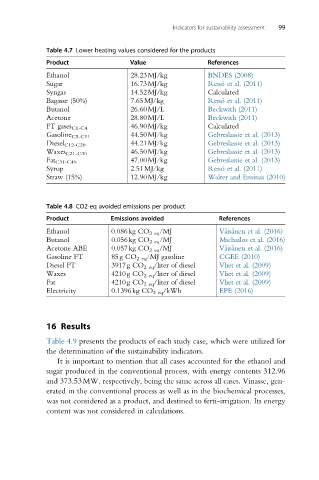
Table 4.7 Lower heating values considered for the products
Product Value References
Ethanol 28.23MJ/kg BNDES (2008)
Sugar 16.73MJ/kg Reno ´ et al. (2011)
Syngas 14.52MJ/kg Calculated
Bagasse (50%) 7.65MJ/kg Reno ´ et al. (2011)
Butanol 26.60MJ/L Beckwith (2011)
Acetone 28.80MJ/L Beckwith (2011)
46.90MJ/kg Calculated
FT gases C1-C4
44.50MJ/kg Gebreslassie et al. (2013)
Gasoline C5-C11
Diesel C12-C20 44.21MJ/kg Gebreslassie et al. (2013)
46.50MJ/kg Gebreslassie et al. (2013)
Waxes C21-C30
47.00MJ/kg Gebreslassie et al. (2013)
Fat C31-C40
Syrup 2.51MJ/kg Reno ´ et al. (2011)
Straw (15%) 12.90MJ/kg Walter and Ensinas (2010)
Table 4.8 CO2-eq avoided emissions per product
Product Emissions avoided References
Ethanol 0.086kg CO 2eq /MJ V€ais€anen et al. (2016)
Butanol 0.056kg CO 2eq /MJ Michailos et al. (2016)
Acetone ABE 0.057kg CO 2eq /MJ V€ais€anen et al. (2016)
Gasoline FT 85g CO 2eq /MJ gasoline CGEE (2010)
Diesel FT 3917g CO 2eq /liter of diesel Vliet et al. (2009)
Waxes 4210g CO 2eq /liter of diesel Vliet et al. (2009)
Fat 4210g CO 2eq /liter of diesel Vliet et al. (2009)
Electricity 0.1396kg CO 2eq /kWh EPE (2016)
16 Results
Table 4.9 presents the products of each study case, which were utilized for
the determination of the sustainability indicators.
It is important to mention that all cases accounted for the ethanol and
sugar produced in the conventional process, with energy contents 312.96
and 373.53MW, respectively, being the same across all cases. Vinasse, gen-
erated in the conventional process as well as in the biochemical processes,
was not considered as a product, and destined to ferti-irrigation. Its energy
content was not considered in calculations.