
Page 116 - Biofuels for a More Sustainable Future
P. 116
Indicators for sustainability assessment 103
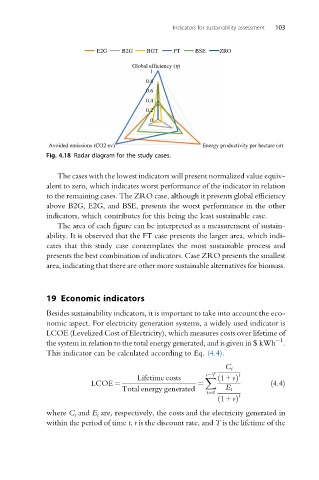
E2G B2G BGT FT BSE ZRO
Global efficiency (h)
1
0.8
0.6
0.4
0.2
0
Avoided emissions (CO2 ev) Energy productivity per hectare (s)
Fig. 4.18 Radar diagram for the study cases.
The cases with the lowest indicators will present normalized value equiv-
alent to zero, which indicates worst performance of the indicator in relation
to the remaining cases. The ZRO case, although it presents global efficiency
above B2G, E2G, and BSE, presents the worst performance in the other
indicators, which contributes for this being the least sustainable case.
The area of each figure can be interpreted as a measurement of sustain-
ability. It is observed that the FT case presents the larger area, which indi-
cates that this study case contemplates the most sustainable process and
presents the best combination of indicators. Case ZRO presents the smallest
area, indicating that there are other more sustainable alternatives for biomass.
19 Economic indicators
Besides sustainability indicators, it is important to take into account the eco-
nomic aspect. For electricity generation systems, a widely used indicator is
LCOE (Levelized Cost of Electricity), which measures costs over lifetime of
1
the system in relation to the total energy generated, and is given in $ kWh .
This indicator can be calculated according to Eq. (4.4).
C t
t¼T t
Lifetime costs X ð 1+ rÞ
LCOE ¼ ¼ (4.4)
Total energy generated E t
t¼0
t
ð 1+ rÞ
where C t and E t are, respectively, the costs and the electricity generated in
within the period of time t, r is the discount rate, and T is the lifetime of the