
Page 115 - Biofuels for a More Sustainable Future
P. 115
102 Biofuels for a More Sustainable Future
tonnes per crop). In the cases where there are other products besides elec-
tricity, there are higher avoided emissions. This demonstrates that the envi-
ronmental benefits associated with diversification of production in the sugar
and ethanol industry reflect on the environmental benefits resultant of the
application of the obtained products. The production of biofuels and other
chemical products is more attractive, from the viewpoint of avoided emis-
sions, than the production of electricity. This occurs because the Brazilian
energy matrix is mainly based on renewable resources.
Comparison of the B2G case with the E2G, FT, and BSE cases highlights
much lower avoided emissions than the other processes, because the B2G
case presents low productivity. Due to this reason, less products substitute
a less fossil fuel-based products, avoiding less emissions.
The FT case, which contemplates the thermochemical route, presented
slightly higher performance in comparison with the remaining cases, as more
products are obtained yielding a higher substitution of fossil fuels.
18 Comparative analysis
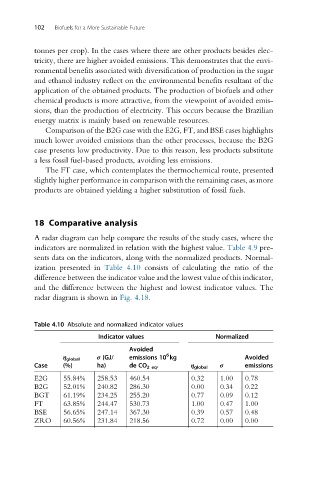
A radar diagram can help compare the results of the study cases, where the
indicators are normalized in relation with the highest value. Table 4.9 pre-
sents data on the indicators, along with the normalized products. Normal-
ization presented in Table 4.10 consists of calculating the ratio of the
difference between the indicator value and the lowest value of this indicator,
and the difference between the highest and lowest indicator values. The
radar diagram is shown in Fig. 4.18.
Table 4.10 Absolute and normalized indicator values
Indicator values Normalized
Avoided
6
σ (GJ/ emissions 10 kg Avoided
η global
Case (%) ha) de CO 2eq . η global σ emissions
E2G 55.84% 258.53 460.54 0.32 1.00 0.78
B2G 52.01% 240.82 286.30 0.00 0.34 0.22
BGT 61.19% 234.25 255.20 0.77 0.09 0.12
FT 63.85% 244.47 530.73 1.00 0.47 1.00
BSE 56.65% 247.14 367.30 0.39 0.57 0.48
ZRO 60.56% 231.84 218.56 0.72 0.00 0.00