
Page 113 - Biofuels for a More Sustainable Future
P. 113
100 Biofuels for a More Sustainable Future
Table 4.9 Amounts of products involved in each study case
Products Base Zero E2G B2G FT BGT
Ethanol (liters/h) 10,192.2 0 30,576.6 0 0
Butanol (liters/h) 3049.9 0 0 11,714.6 0 0
Acetone (liters/h) 1072.8 0 0 3215.4 0 0
Ethanol (liters/h) 273.1 0 0 819.2 0 0
Gasoline (liters/h) 1686.1 0 0 0 8093.2 0
Diesel (liters/h) 1596.4 0 0 0 7662.6 0
Waxes (liters/h) 857.5 0 0 0 4116.0 0
Fats (liters/h) 335.8 0 0 0 1612.0 0
Surplus electricity 196.14 276.52 200.87 199.57 117.44 289.57
(MWh)
17 Global efficiency and net productivity per hectare
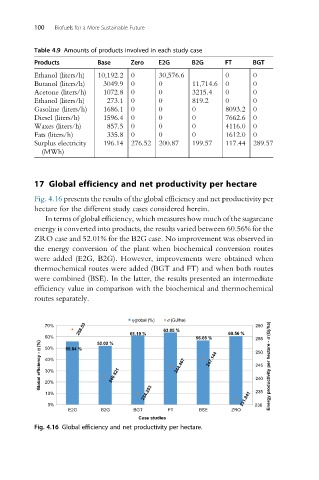
Fig. 4.16 presents the results of the global efficiency and net productivity per
hectare for the different study cases considered herein.
In terms of global efficiency, which measures how much of the sugarcane
energy is converted into products, the results varied between 60.56% for the
ZRO case and 52.01% for the B2G case. No improvement was observed in
the energy conversion of the plant when biochemical conversion routes
were added (E2G, B2G). However, improvements were obtained when
thermochemical routes were added (BGT and FT) and when both routes
were combined (BSE). In the latter, the results presented an intermediate
efficiency value in comparison with the biochemical and thermochemical
routes separately.
h global (%) s (GJ/ha)
258.53 63.85 %
70% 260
60% 55.84 % 52.02 % 61.19 % 56.65 % 60.56 % 255
Global efficiency - h (%) 40% 240.821 244.467 247.144 250 Energy productivity per hectare - s (Gj/ha)
50%
245
30%
240
20%
10% 234.253 231.841 235
0% 230
E2G B2G BGT FT BSE ZRO
Case studies
Fig. 4.16 Global efficiency and net productivity per hectare.