
Page 114 - Biofuels for a More Sustainable Future
P. 114
Indicators for sustainability assessment 101
The efficiencies obtained for cases E2G, B2G, and BSE are lower than
for the ZRO case. The utilization of thermal energy and electricity in the
processes strongly influences the final result obtained. Therefore the global
efficiencies of energy conversion in the cases that present biochemical routes
are lower than the ZRO case due to the high energy demands (ZRO rep-
resents the conventional system currently employed by the Brazilian indus-
try). This might seem contradictory, as there are no benefits associated with
the diversification of production. However, analysis of the FT case, which
presents the higher diversification within the analyzed study cases, demon-
strates its highest global efficiency value.
The low energy performance indicated the necessity of increasing the
output energy flows. In other words, improvements are still necessary in
the processes, aiming at better conversion of bagasse.
However, when energy productivity is calculated per hectare, the worst
result corresponds to the ZRO case. This affects land use as it is possible to
increase the production of fuels, energy, and food without the occupation of
more area. In this sense, the E2G case, with cellulosic ethanol, results in the
highest net productivity value (258,532GJ/ha). It must be highlighted that
in the calculations of efficiency and energy productivity per hectare, the
energy contents of conventional ethanol and sugar were taken into account
in calculations.
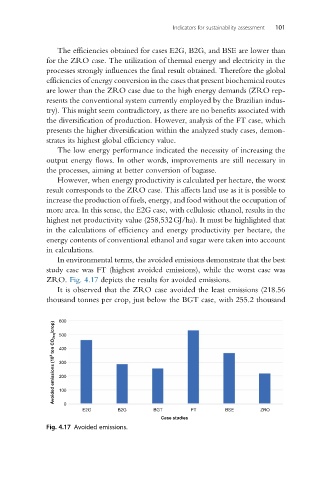
In environmental terms, the avoided emissions demonstrate that the best
study case was FT (highest avoided emissions), while the worst case was
ZRO. Fig. 4.17 depicts the results for avoided emissions.
It is observed that the ZRO case avoided the least emissions (218.56
thousand tonnes per crop, just below the BGT case, with 255.2 thousand
600
Avoided emissions (10 3 ton CO 2eq /crop) 500
400
300
200
100
0
E2G B2G BGT FT BSE ZRO
Case studies
Fig. 4.17 Avoided emissions.