
Page 120 - Biofuels for a More Sustainable Future
P. 120
Indicators for sustainability assessment 107
Table 4.13 Product tariffs
Product Price References
Gasoline US$ 1.10/L MME (2016)
Diesel US$ 1.00/L MME (2016)
Waxes US$ 0.22/L Im-orb et al. (2016)
Greases US$ 0.22/L Im-orb et al. (2016)
Electricity US$ 76.00/MWh Petersen et al. (2015)
Exchange rate of US$1.00¼R$3.00 and 1 US$¼0.95 Euros.
The capital cost of plants, with all pretreatment and cleaning systems,
ASU, gasifiers, BIG-GTCC system, and so on, corresponds to US$ 632.43
million. After consideration of taxes, fixed and variable costs, a gross profit
of US$ 20.34 million per period was obtained. Therefore for the scenario
established herein, NPV is negative, corresponding to US$ 583.44 million,
demonstrating economic unfeasibility.
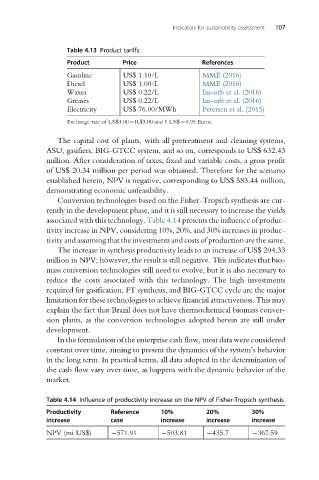
Conversion technologies based on the Fisher-Tropsch synthesis are cur-
rently in the development phase, and it is still necessary to increase the yields
associated with this technology. Table 4.14 presents the influence of produc-
tivity increase in NPV, considering 10%, 20%, and 30% increases in produc-
tivity and assuming that the investments and costs of production are the same.
The increase in synthesis productivity leads to an increase of US$ 204.33
million in NPV; however, the result is still negative. This indicates that bio-
mass conversion technologies still need to evolve, but it is also necessary to
reduce the costs associated with this technology. The high investments
required for gasification, FT synthesis, and BIG-GTCC cycle are the major
limitation for these technologies to achieve financial attractiveness. This may
explain the fact that Brazil does not have thermochemical biomass conver-
sion plants, as the conversion technologies adopted herein are still under
development.
In the formulation of the enterprise cash flow, most data were considered
constant over time, aiming to present the dynamics of the system’s behavior
in the long term. In practical terms, all data adopted in the determination of
the cash flow vary over time, as happens with the dynamic behavior of the
market.
Table 4.14 Influence of productivity increase on the NPV of Fisher-Tropsch synthesis
Productivity Reference 10% 20% 30%
increase case increase increase increase
NPV (mi US$) 571.91 503.81 435.7 367.59