
Page 121 - Biofuels for a More Sustainable Future
P. 121
108 Biofuels for a More Sustainable Future
A sensitivity analysis can help identify which variables affect the eco-
nomic viability of a biorefinery project, including variations in the prices
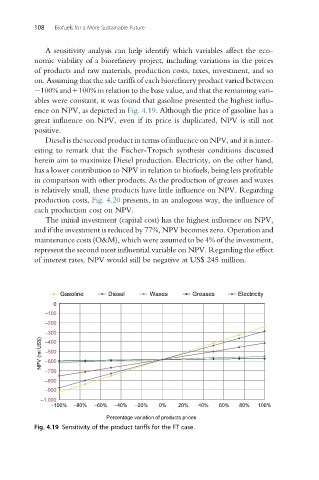
of products and raw materials, production costs, taxes, investment, and so
on. Assuming that the sale tariffs of each biorefinery product varied between
100% and+100% in relation to the base value, and that the remaining vari-
ables were constant, it was found that gasoline presented the highest influ-
ence on NPV, as depicted in Fig. 4.19. Although the price of gasoline has a
great influence on NPV, even if its price is duplicated, NPV is still not
positive.
Diesel is the second product in terms of influence on NPV, and it is inter-
esting to remark that the Fischer-Tropsch synthesis conditions discussed
herein aim to maximize Diesel production. Electricity, on the other hand,
has a lower contribution to NPV in relation to biofuels, being less profitable
in comparison with other products. As the production of greases and waxes
is relatively small, these products have little influence on NPV. Regarding
production costs, Fig. 4.20 presents, in an analogous way, the influence of
each production cost on NPV.
The initial investment (capital cost) has the highest influence on NPV,
and if the investment is reduced by 77%, NPV becomes zero. Operation and
maintenance costs (O&M), which were assumed to be 4% of the investment,
represent the second most influential variable on NPV. Regarding the effect
of interest rates, NPV would still be negative at US$ 245 million.
Gasoline Diesel Waxes Greases Electricity
0
–100
–200
–300
NPV (mi US$) –500
–400
–600
–700
–800
–900
–1.000
–100% –80% –60% –40% –20% 0% 20% 40% 60% 80% 100%
Percentage variation of products prices
Fig. 4.19 Sensitivity of the product tariffs for the FT case.