
Page 96 - Biofuels for a More Sustainable Future
P. 96
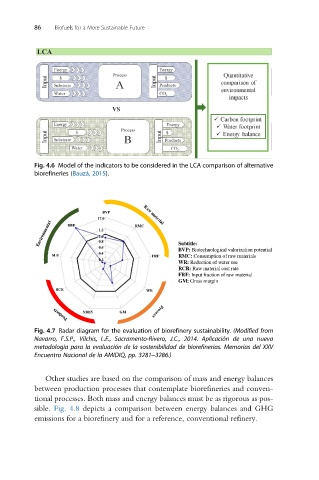
86    Biofuels for a More Sustainable Future


          Fig. 4.6 Model of the indicators to be considered in the LCA comparison of alternative
          biorefineries (Bauzá, 2015).


                             BVP
                           17.0
                   RBE                RMC
                            1.2
                            1.0
                            0.8
                                                 Subtitle:
                            0.6
                                                 BVP: Biotechnological valorization potential
                            0.4
               SLU                        FRF    RMC: Consumption of raw materials
                            0.2
                                                 WR: Reduction of water use
                                                 RCR: Raw material cost rate
                                                 FRF: Input fraction of raw material
                                                 GM: Gross margin
                RCR                      WR
                       NRES      GM
          Fig. 4.7 Radar diagram for the evaluation of biorefinery sustainability. (Modified from
          Navarro, F.S.P., Vilchis, L.E., Sacramento-Rivero, J.C., 2014. Aplicación de una nueva
          metodología para la evaluación de la sostenibilidad de biorefinerias. Memorias del XXV
          Encuentro Nacional de la AMIDIQ, pp. 3281–3286.)

             Other studies are based on the comparison of mass and energy balances
          between production processes that contemplate biorefineries and conven-
          tional processes. Both mass and energy balances must be as rigorous as pos-
          sible. Fig. 4.8 depicts a comparison between energy balances and GHG
          emissions for a biorefinery and for a reference, conventional refinery.