
Page 101 - Biofuels for a More Sustainable Future
P. 101
90 Biofuels for a More Sustainable Future
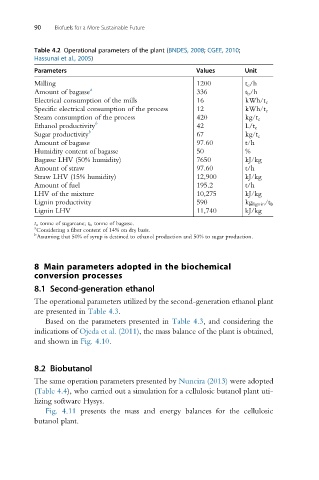
Table 4.2 Operational parameters of the plant (BNDES, 2008; CGEE, 2010;
Hassunai et al., 2005)
Parameters Values Unit
Milling 1200 t c /h
Amount of bagasse a 336 t b /h
Electrical consumption of the mills 16 kWh/t c
Specific electrical consumption of the process 12 kWh/t c
Steam consumption of the process 420 kg/t c
Ethanol productivity b 42 L/t c
b
Sugar productivity 67 kg/t c
Amount of bagasse 97.60 t/h
Humidity content of bagasse 50 %
Bagasse LHV (50% humidity) 7650 kJ/kg
Amount of straw 97.60 t/h
Straw LHV (15% humidity) 12,900 kJ/kg
Amount of fuel 195.2 t/h
LHV of the mixture 10,275 kJ/kg
Lignin productivity 590 kg lignin /t b
Lignin LHV 11,740 kJ/kg
t c , tonne of sugarcane; t b , tonne of bagasse.
a
Considering a fiber content of 14% on dry basis.
b
Assuming that 50% of syrup is destined to ethanol production and 50% to sugar production.
8 Main parameters adopted in the biochemical
conversion processes
8.1 Second-generation ethanol
The operational parameters utilized by the second-generation ethanol plant
are presented in Table 4.3.
Based on the parameters presented in Table 4.3, and considering the
indications of Ojeda et al. (2011), the mass balance of the plant is obtained,
and shown in Fig. 4.10.
8.2 Biobutanol
The same operation parameters presented by Nuncira (2013) were adopted
(Table 4.4), who carried out a simulation for a cellulosic butanol plant uti-
lizing software Hysys.
Fig. 4.11 presents the mass and energy balances for the cellulosic
butanol plant.