
Page 90 - Biomass Gasification, Pyrolysis And Torrefaction Practical Design and Theory
P. 90
68 Biomass Gasification, Pyrolysis and Torrefaction
These components are given by the following empirical relations,
which are used to calculate the directional values of thermal conductivities
(all thermal conductivities are in w/m K):
26 2
23
K w 520:487 1 5:887 3 10 T 7:39 3 10 T
24
27 2
K g 527:494 3 10 23 1 1:709 3 10 T 2:377 3 10 T
T
1 2:202 3 10 210 3 214 4 217 5
T 9:463 3 10
T 1 1:581 3 10
K s 5 0:52 in perpendicular direction (3.11)
3
K rad 5 5:33e rad σT d pore (3.12)
where e rad is the emissivity in the pores having diameter d pore , σ is the
Stefan Boltzmann constant, and T is the temperature in K. The contribution
of gas radiation in the pores, K rad , to conductivity is important only at high
temperatures.
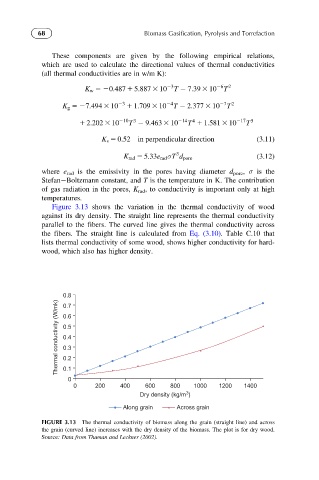
Figure 3.13 shows the variation in the thermal conductivity of wood
against its dry density. The straight line represents the thermal conductivity
parallel to the fibers. The curved line gives the thermal conductivity across
the fibers. The straight line is calculated from Eq. (3.10). Table C.10 that
lists thermal conductivity of some wood, shows higher conductivity for hard-
wood, which also has higher density.
0.8
Thermal conductivity (W/mk) 0.6
0.7
0.5
0.4
0.3
0.2
0.1
0
0 200 400 600 800 1000 1200 1400
3
Dry density (kg/m )
Along grain Across grain
FIGURE 3.13 The thermal conductivity of biomass along the grain (straight line) and across
the grain (curved line) increases with the dry density of the biomass. The plot is for dry wood.
Source: Data from Thuman and Leckner (2002).