Page 183 - Biomedical Engineering and Design Handbook Volume 1, Fundamentals
P. 183

160  BIOMECHANICS OF THE HUMAN BODY

                                      A   Force (KN)
                                          1.0

                                                   Gracilis
                                          0.8      tendon

                                          0.6


                                          0.4


                                                       Fascia
                                          0.2
                                                        lata
                                           0
                                             0 2   4  6  8 10 12 14
                                                    Length (mm)

                                      B   Force (KN)
                                          5.0


                                          4.0
                                               Medial patellar tendon
                                          3.0

                                          2.0

                                                                Anterior cruciate
                                          1.0                   ligament

                                           0
                                             0      5    10   15     20
                                                     Length (mm)
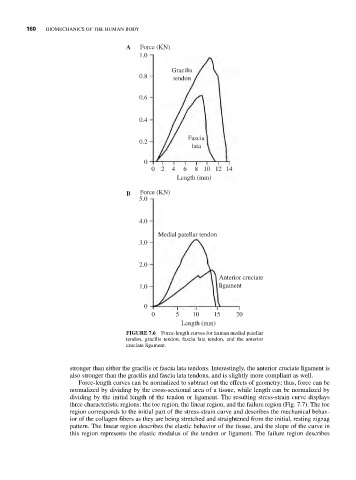
                                      FIGURE 7.6  Force-length curves for human medial patellar
                                      tendon, gracilis tendon, fascia lata tendon, and the anterior
                                      cruciate ligament.


                       stronger than either the gracilis or fascia lata tendons. Interestingly, the anterior cruciate ligament is
                       also stronger than the gracilis and fascia lata tendons, and is slightly more compliant as well.
                         Force-length curves can be normalized to subtract out the effects of geometry; thus, force can be
                       normalized by dividing by the cross-sectional area of a tissue, while length can be normalized by
                       dividing by the initial length of the tendon or ligament. The resulting stress-strain curve displays
                       three characteristic regions: the toe region, the linear region, and the failure region (Fig. 7.7). The toe
                       region corresponds to the initial part of the stress-strain curve and describes the mechanical behav-
                       ior of the collagen fibers as they are being stretched and straightened from the initial, resting zigzag
                       pattern. The linear region describes the elastic behavior of the tissue, and the slope of the curve in
                       this region represents the elastic modulus of the tendon or ligament. The failure region describes
   178   179   180   181   182   183   184   185   186   187   188