
Page 299 - Biomedical Engineering and Design Handbook Volume 1, Fundamentals
P. 299
276 BIOMECHANICS OF THE HUMAN BODY
11.3.3 Biodynamic Fidelity of Human Surrogates
Animals, cadavers, manikins, and computer models have been used to predict human responses to
potentially injurious or life-threatening stimuli. To evaluate the biofidelity of the surrogate or model,
it is necessary to identify the response characteristics that are most relevant (Griffin, 2001). For
biodynamic responses, the time histories of the acceleration, velocity, displacement, and forces provide
the most meaningful comparisons, though point-by-point comparisons can be misleading if the
system response to the stimulus of interest is extremely nonlinear. In these circumstances, evaluating
peak values in the time history, impulses calculated from the acceleration or contact forces, or energy
absorption may be more appropriate.
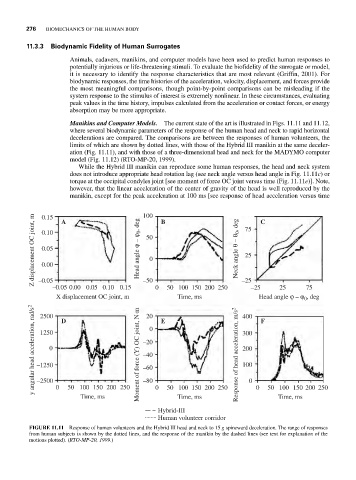
Manikins and Computer Models. The current state of the art is illustrated in Figs. 11.11 and 11.12,
where several biodynamic parameters of the response of the human head and neck to rapid horizontal
decelerations are compared. The comparisons are between the responses of human volunteers, the
limits of which are shown by dotted lines, with those of the Hybrid III manikin at the same deceler-
ation (Fig. 11.11), and with those of a three-dimensional head and neck for the MADYMO computer
model (Fig. 11.12) (RTO-MP-20, 1999).
While the Hybrid III manikin can reproduce some human responses, the head and neck system
does not introduce appropriate head rotation lag (see neck angle versus head angle in Fig. 11.11c) or
torque at the occipital condyles joint [see moment of force OC joint versus time (Fig. 11.11e)]. Note,
however, that the linear acceleration of the center of gravity of the head is well reproduced by the
manikin, except for the peak acceleration at 100 ms [see response of head acceleration versus time
Z displacement OC joint, m 0.10 Head angle ϕ – ϕ 0 , deg 100 Neck angle θ – θ 0 , deg 75
0.15
C
B
A
50
0.05
25
0
0.00
–0.05
–0.05 0.00 0.05 0.10 0.15 –50 0 50 100 150 200 250 –25 –25 25 75
X displacement OC joint, m 20 E Time, ms 400 Head angle ϕ – ϕ , deg
0
y angular head acceleration, rad/s 2 –1250 Moment of force (Y) OC joint, N·m –20 Response of head acceleration, m/s 2 300
2500
F
D
0
1250
0
200
–40
100
–60
–2500
100
0
50
150
Time, ms
Time, ms 200 250 –80 0 50 100 150 200 250 0 0 50 100 150 200 250
Time, ms
Hybrid-III
Human volunteer corridor
FIGURE 11.11 Response of human volunteers and the Hybrid III head and neck to 15 g spineward deceleration. The range of responses
from human subjects is shown by the dotted lines, and the response of the manikin by the dashed lines (see text for explanation of the
motions plotted). (RTO-MP-20, 1999.)