
Page 41 - Biomedical Engineering and Design Handbook Volume 1, Fundamentals
P. 41
18 BIOMEDICAL SYSTEMS ANALYSIS
34.07
A
27.25
Production rate 20.44
13.63
5.81
0.00
0.00 0.80 1.60 2.40 3.20 4.00 4.80 5.60 6.40 7.20 8.00
Time in days
1.06
B
0.85
Target cells 0.63
0.42
0.21
0.00
0.00 0.80 1.60 2.40 3.20 4.00 4.80 5.60 6.40 7.20 8.00
Time in days
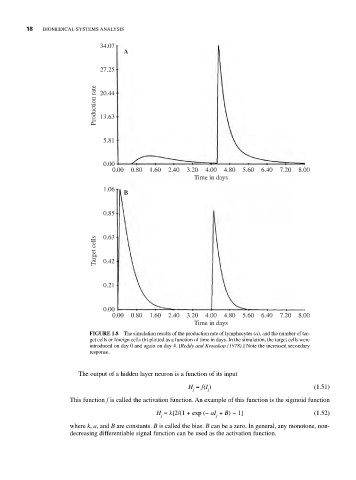
FIGURE 1.8 The simulation results of the production rate of lymphocytes (a), and the number of tar-
get cells or foreign cells (b) plotted as a function of time in days. In the simulation, the target cells were
introduced on day 0 and again on day 4. [Reddy and Krouskop (1978).] Note the increased secondary
response.
The output of a hidden layer neuron is a function of its input
H = f(I ) (1.51)
j j
This function f is called the activation function. An example of this function is the sigmoid function
H = k[2/(1 + exp (− aI + B) − 1] (1.52)
j j
where k, a, and B are constants. B is called the bias. B can be a zero. In general, any monotone, non-
decreasing differentiable signal function can be used as the activation function.