
Page 300 - Biosystems Engineering
P. 300
Biodiesel and Ethanol in Engines 277
results in higher smoke because there is a lesser amount of oxygen
available. Hence, overloading the engine will result in a very black
smoke. It is observed that smoke level decreases with ethanol fumi-
gation. Fumigation of ethanol starts precombustion reactions before
and during a compression stroke, resulting in reduced chemical delay
because the intermediate products such as peroxides and aldehydes
react more rapidly with oxygen than with original hydrocarbons.
This shortening of the delay period curbs thermal cracking, which is
responsible for soot formation that results in a reduction of smoke. It
is observed that at an engine speed 800 rpm and at no load, the smoke
level is decreased by 91.66, 75, and 41.59 percent at ethanol fumiga-
tion rates of 1.06, 1.45, and 2.06 kg/h (45.00, 54.57, and 62.17 percent
diesel substitution), respectively, when compared to the smoke level
under diesel fuel operation. At a high load of 6.31 kW, the smoke
level is decreased by 68.18, 50.10, and 40.90 percent at ethanol fumi-
gation rates of 1.06, 1.45, and 2.06 kg/h, respectively, when compared
to the smoke level under diesel fuel operation.
8.2.8 Effect of Brake Power on Exhaust Gas Temperatures
at Various Ethanol Fumigation Rates
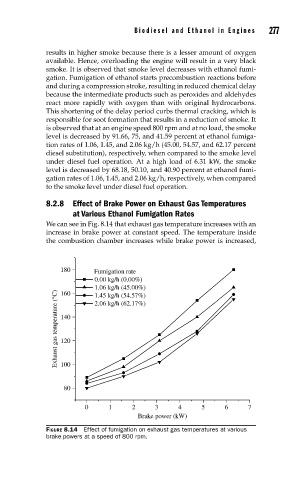
We can see in Fig. 8.14 that exhaust gas temperature increases with an
increase in brake power at constant speed. The temperature inside
the combustion chamber increases while brake power is increased,
180 Fumigation rate
0.00 kg/h (0.00%)
1.06 kg/h (45.00%)
Exhaust gas temperature (°C) 140
160
1.45 kg/h (54.57%)
2.06 kg/h (62.17%)
120
100
80
0 1 2 3 4 5 6 7
Brake power (kW)
FIGURE 8.14 Effect of fumigation on exhaust gas temperatures at various
brake powers at a speed of 800 rpm.