
Page 296 - Biosystems Engineering
P. 296
Biodiesel and Ethanol in Engines 273
engine while the ethanol fumigation rate is increased. At engine
speed of 800 rpm and load of 1.58 kW, BSDFC is decreased by 28.86,
41.23, and 38.14 percent at ethanol fumigation rates of 1.06, 1.45, and
2.06 kg/h (45, 54.57, and 62.17 percent diesel substitution), respec-
tively, when compared to the BSDFC under diesel fuel operation.
At a high load of 6.31 kW, the BSDFC is decreased by 29.26, 24.39, and
36.58 percent at ethanol fumigation rates of 1.06, 1.45, and 2.06 kg/h,
respectively, when compared to the BSDFC under diesel fuel opera-
tion. At an ethanol fumigation rate of 1.06 kg/h and at a low load of
1.58 kW, the BSDFC is decreased by 28.86, 9.52, 19.79, and 13.63 percent
at engine speeds of 800, 900, 1000, and 1100 rpm, respectively.
8.2.4 Effect of Brake Power on Diesel Substitutions
at Various Ethanol Fumigation Rates
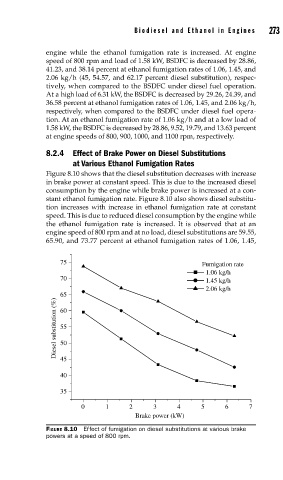
Figure 8.10 shows that the diesel substitution decreases with increase
in brake power at constant speed. This is due to the increased diesel
consumption by the engine while brake power is increased at a con-
stant ethanol fumigation rate. Figure 8.10 also shows diesel substitu-
tion increases with increase in ethanol fumigation rate at constant
speed. This is due to reduced diesel consumption by the engine while
the ethanol fumigation rate is increased. It is observed that at an
engine speed of 800 rpm and at no load, diesel substitutions are 59.55,
65.90, and 73.77 percent at ethanol fumigation rates of 1.06, 1.45,
75 Fumigation rate
1.06 kg/h
70 1.45 kg/h
2.06 kg/h
65
Diesel substitution (%) 55
60
50
45
40
35
0 1 2 3 4 5 6 7
Brake power (kW)
FIGURE 8.10 Effect of fumigation on diesel substitutions at various brake
powers at a speed of 800 rpm.