
Page 294 - Biosystems Engineering
P. 294
Biodiesel and Ethanol in Engines 271
is measured by a hand tachometer. A stopwatch is used to measure
the consumption of diesel and the fumigation of ethanol.
The performance and emission of the Perkins four-cylinder diesel
engine under various brake powers (0, 1.58, 3.12, 4.74, and 6.31 kW),
different speeds (800, 900, 1000, and 1100 rpm), and dehydrated etha-
nol (200 proof) fumigation rates (0, 1.06, 1.45, and 2.06 kg/h) are deter-
mined in terms of brake thermal efficiency, brake-specific fuel con-
sumption, diesel substitution, NO emission level, CO emission level,
x
smoke density, and exhaust gas temperature.
In order to achieve the objectives of the investigations, 80 experi-
ments were carried out for diesel fuel and dual fuel (diesel + fumigated
ethanol) operations.
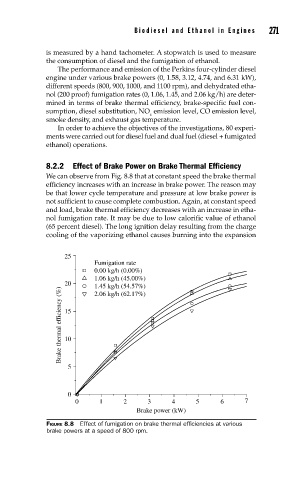
8.2.2 Effect of Brake Power on Brake Thermal Efficiency
We can observe from Fig. 8.8 that at constant speed the brake thermal
efficiency increases with an increase in brake power. The reason may
be that lower cycle temperature and pressure at low brake power is
not sufficient to cause complete combustion. Again, at constant speed
and load, brake thermal efficiency decreases with an increase in etha-
nol fumigation rate. It may be due to low calorific value of ethanol
(65 percent diesel). The long ignition delay resulting from the charge
cooling of the vaporizing ethanol causes burning into the expansion
25
Fumigation rate
0.00 kg/h (0.00%)
1.06 kg/h (45.00%)
20 1.45 kg/h (54.57%)
Brake thermal efficiency (%) 15
2.06 kg/h (62.17%)
10
5
0
0 1 2 3 4 5 6 7
Brake power (kW)
FIGURE 8.8 Effect of fumigation on brake thermal effi ciencies at various
brake powers at a speed of 800 rpm.