
Page 299 - Biosystems Engineering
P. 299
276 Cha pte r Ei g h t
receiving an especially rich charge while others are lean. Because of
poor cylinder-to-cylinder distribution, this one cylinder might be pro-
ducing high CO emissions while others are low. It is likely that at least
a portion of the fumigated ethanol enters the cylinder as a liquid, and
because the intake manifold of the diesel engine is not generally designed
for good distribution on liquid fuels, poor cylinder-to-cylinder distribu-
tion and a high spatial variation in the fuel-to-air ratio within the
cylinder are strong possibilities for an increased CO emission level.
Therefore, increases in CO emission levels with increasing fumigation
rates are a result of incomplete combustion of an air–ethanol mixture.
It is observed that at an ethanol fumigation rate of 1.06 kg/h and at
no load, the CO emission level is increased by 0.104, 0.03, 0.012, and
0.028 percent at engine speeds of 800, 900, 1000, and 1100 rpm, respec-
tively, when compared to the emission under diesel fuel operation.
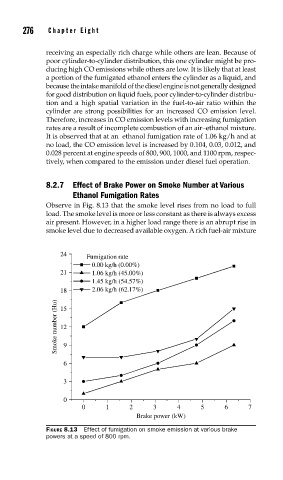
8.2.7 Effect of Brake Power on Smoke Number at Various
Ethanol Fumigation Rates
Observe in Fig. 8.13 that the smoke level rises from no load to full
load. The smoke level is more or less constant as there is always excess
air present. However, in a higher load range there is an abrupt rise in
smoke level due to decreased available oxygen. A rich fuel-air mixture
24 Fumigation rate
0.00 kg/h (0.00%)
21 1.06 kg/h (45.00%)
1.45 kg/h (54.57%)
18 2.06 kg/h (62.17%)
Smoke number (Hu) 15 9
12
6
3
0
0 1 2 3 4 5 6 7
Brake power (kW)
FIGURE 8.13 Effect of fumigation on smoke emission at various brake
powers at a speed of 800 rpm.