
Page 298 - Biosystems Engineering
P. 298
Biodiesel and Ethanol in Engines 275
NO emission level is decreased by 51.12, 68.72, and 81.24 percent at
x
ethanol fumigation rates of 1.06, 1.45, and 2.06 kg/h, respectively,
when compared to the NO level under diesel fuel operation. It is
x
observed that at an ethanol fumigation rate of 1.06 kg/h and at no load,
the NO emission level is reduced by 100, 80, 82.5, and 74.46 percent
x
at engine speeds of 800, 900, 1000, and 1100 rpm, respectively.
8.2.6 Effect of Brake Power on CO Emissions at Various
Ethanol Fumigation Rates
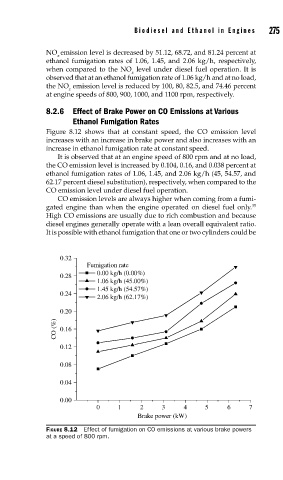
Figure 8.12 shows that at constant speed, the CO emission level
increases with an increase in brake power and also increases with an
increase in ethanol fumigation rate at constant speed.
It is observed that at an engine speed of 800 rpm and at no load,
the CO emission level is increased by 0.104, 0.16, and 0.038 percent at
ethanol fumigation rates of 1.06, 1.45, and 2.06 kg/h (45, 54.57, and
62.17 percent diesel substitution), respectively, when compared to the
CO emission level under diesel fuel operation.
CO emission levels are always higher when coming from a fumi-
gated engine than when the engine operated on diesel fuel only. 35
High CO emissions are usually due to rich combustion and because
diesel engines generally operate with a lean overall equivalent ratio.
It is possible with ethanol fumigation that one or two cylinders could be
0.32
Fumigation rate
0.00 kg/h (0.00%)
0.28
1.06 kg/h (45.00%)
1.45 kg/h (54.57%)
0.24
2.06 kg/h (62.17%)
0.20
CO (%) 0.16
0.12
0.08
0.04
0.00
0 1 2 3 4 5 6 7
Brake power (kW)
FIGURE 8.12 Effect of fumigation on CO emissions at various brake powers
at a speed of 800 rpm.