
Page 295 - Biosystems Engineering
P. 295
272 Cha pte r Ei g h t
stroke, resulting in a reduction in brake thermal efficiency. At an
engine speed of 800 rpm and at a 1.58-kW load, brake thermal effi-
ciency is decreased by 1.11, 1.33, and 2.30 percent at ethanol fumiga-
tion rates of 1.06, 1.45, and 2.06 kg/h (45, 54.57, and 62.17 percent
diesel substitution), respectively, when compared to the brake ther-
mal efficiency under diesel operation. At ethanol fumigation rate of
1.06 kg/h (45 percent diesel substitution) and at low load (1.58 kW)
the brake thermal efficiency is reduced by 1.11, 2.49, 0.96, and
1.53 percent at engine speed of 800, 900, 1000, and 1100 rpm, respec-
tively, when compared to the efficiency under diesel fuel operation.
8.2.3 Effect of Brake Power on Brake-Specific Diesel
Fuel Consumption
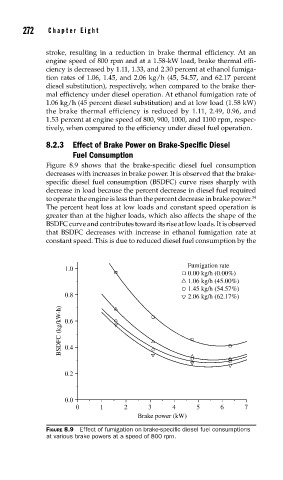
Figure 8.9 shows that the brake-specific diesel fuel consumption
decreases with increases in brake power. It is observed that the brake-
specific diesel fuel consumption (BSDFC) curve rises sharply with
decrease in load because the percent decrease in diesel fuel required
to operate the engine is less than the percent decrease in brake power. 34
The percent heat loss at low loads and constant speed operation is
greater than at the higher loads, which also affects the shape of the
BSDFC curve and contributes toward its rise at low loads. It is observed
that BSDFC decreases with increase in ethanol fumigation rate at
constant speed. This is due to reduced diesel fuel consumption by the
Fumigation rate
1.0
0.00 kg/h (0.00%)
1.06 kg/h (45.00%)
1.45 kg/h (54.57%)
0.8 2.06 kg/h (62.17%)
BSDFC (kg/kW-h) 0.6
0.4
0.2
0.0
0 1 2 3 4 5 6 7
Brake power (kW)
FIGURE 8.9 Effect of fumigation on brake-specifi c diesel fuel consumptions
at various brake powers at a speed of 800 rpm.