
Page 297 - Biosystems Engineering
P. 297
274 Cha pte r Ei g h t
and 2.06 kg/h, respectively. At a high load of 6.31 kW, diesel sub-
stitutions are 36.55, 42.52, and 52.17 percent at ethanol fumigation
rates of 1.06, 1.45, and 2.06 kg/h respectively. It is observed that at
ethanol fumigation rate of 1.06 kg/h and at no load, diesel substitu-
tions are 59.55, 56.88, 51.45, and 48.18 percent at engine speeds of 800,
900, 1000, and 1100 rpm, respectively.
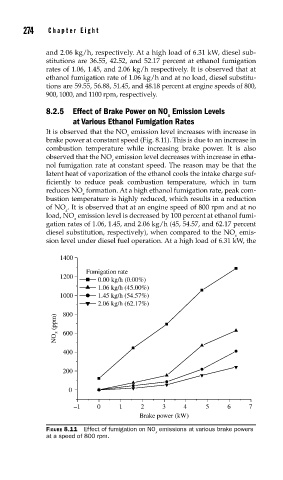
8.2.5 Effect of Brake Power on NO Emission Levels
x
at Various Ethanol Fumigation Rates
It is observed that the NO emission level increases with increase in
x
brake power at constant speed (Fig. 8.11). This is due to an increase in
combustion temperature while increasing brake power. It is also
observed that the NO emission level decreases with increase in etha-
x
nol fumigation rate at constant speed. The reason may be that the
latent heat of vaporization of the ethanol cools the intake charge suf-
ficiently to reduce peak combustion temperature, which in turn
reduces NO formation. At a high ethanol fumigation rate, peak com-
x
bustion temperature is highly reduced, which results in a reduction
of NO . It is observed that at an engine speed of 800 rpm and at no
x
load, NO emission level is decreased by 100 percent at ethanol fumi-
x
gation rates of 1.06, 1.45, and 2.06 kg/h (45, 54.57, and 62.17 percent
diesel substitution, respectively), when compared to the NO emis-
x
sion level under diesel fuel operation. At a high load of 6.31 kW, the
1400
Fumigation rate
1200
0.00 kg/h (0.00%)
1.06 kg/h (45.00%)
1000 1.45 kg/h (54.57%)
2.06 kg/h (62.17%)
800
NO x (ppm) 600
400
200
0
–1 0 1 2 3 4 5 6 7
Brake power (kW)
FIGURE 8.11 Effect of fumigation on NO emissions at various brake powers
x
at a speed of 800 rpm.