
Page 196 - Boiler_Operators_Handbook,_Second_Edition
P. 196
Refrigeration & AC 181
that lady keeps calling and com-
plaining about the conditions in
her office without using the chart.
Plotting the conditions for her of-
fice and the equipment should
lead you to a conclusion as to why
she’s uncomfortable and what you
might be able to do about it. The
alternative is to receive constant
calls to the boiler room and not be-
ing able to respond. I have noticed
that the newer SCADA systems
(System Control and Data Acquisi-
tion) frequently allow the operator
to get a readout of the temperature
in the space in question and the
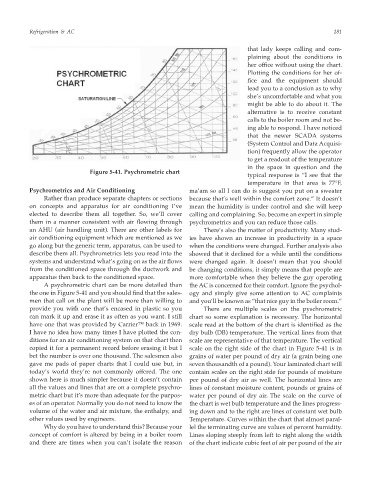
Figure 5-41. Psychrometric chart
typical response is “I see that the
temperature in that area is 77°F,
Psychrometrics and Air Conditioning ma’am so all I can do is suggest you put on a sweater
Rather than produce separate chapters or sections because that’s well within the comfort zone.” It doesn’t
on concepts and apparatus for air conditioning I’ve mean the humidity is under control and she will keep
elected to describe them all together. So, we’ll cover calling and complaining. So, become an expert in simple
them in a manner consistent with air flowing through psychrometrics and you can reduce those calls.
an AHU (air handling unit). There are other labels for There’s also the matter of productivity. Many stud-
air conditioning equipment which are mentioned as we ies have shown an increase in productivity in a space
go along but the generic term, apparatus, can be used to when the conditions were changed. Further analysis also
describe them all. Psychrometrics lets you read into the showed that it declined for a while until the conditions
systems and understand what’s going on as the air flows were changed again. It doesn’t mean that you should
from the conditioned space through the ductwork and be changing conditions, it simply means that people are
apparatus then back to the conditioned space. more comfortable when they believe the guy operating
A psychrometric chart can be more detailed than the AC is concerned for their comfort. Ignore the psychol-
the one in Figure 5-41 and you should find that the sales- ogy and simply give some attention to AC complaints
men that call on the plant will be more than willing to and you’ll be known as “that nice guy in the boiler room.”
provide you with one that’s encased in plastic so you There are multiple scales on the pyschrometric
can mark it up and erase it as often as you want. I still chart so some explanation is necessary. The horizontal
have one that was provided by Carrier™ back in 1969. scale read at the bottom of the chart is identified as the
I have no idea how many times I have plotted the con- dry bulb (DB) temperature. The vertical lines from that
ditions for an air conditioning system on that chart then scale are representative of that temperature. The vertical
copied it for a permanent record before erasing it but I scale on the right side of the chart in Figure 5-41 is in
bet the number is over one thousand. The salesmen also grains of water per pound of dry air (a grain being one
gave me pads of paper charts that I could use but, in seven thousandth of a pound). Your laminated chart will
today’s world they’re not commonly offered. The one contain scales on the right side for pounds of moisture
shown here is much simpler because it doesn’t contain per pound of dry air as well. The horizontal lines are
all the values and lines that are on a complete psychro- lines of constant moisture content, pounds or grains of
metric chart but it’s more than adequate for the purpos- water per pound of dry air. The scale on the curve of
es of an operator. Normally you do not need to know the the chart is wet bulb temperature and the lines progress-
volume of the water and air mixture, the enthalpy, and ing down and to the right are lines of constant wet bulb
other values used by engineers. Temperature. Curves within the chart that almost paral-
Why do you have to understand this? Because your lel the terminating curve are values of percent humidity.
concept of comfort is altered by being in a boiler room Lines sloping steeply from left to right along the width
and there are times when you can’t isolate the reason of the chart indicate cubic feet of air per pound of the air