
Page 17 - Boiler plant and distribution system optimization manual
P. 17
2 Boiler Plant and Distribution System Optimization Manual
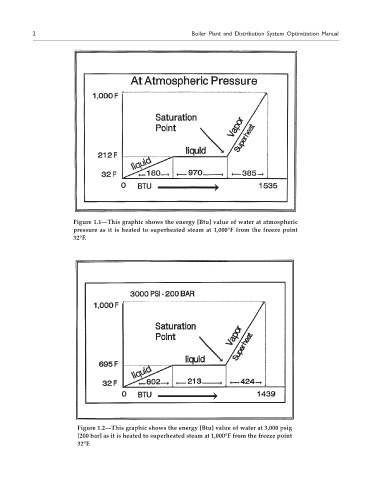
Figure 1.1—This graphic shows the energy [Btu] value of water at atmospheric
pressure as it is heated to superheated steam at 1,000°F from the freeze point
32°F.
Figure 1.2—This graphic shows the energy [Btu] value of water at 3,000 psig
[200 bar] as it is heated to superheated steam at 1,000°F from the freeze point
32°F.