
Page 53 - Boiler plant and distribution system optimization manual
P. 53
38 Boiler Plant and Distribution System Optimization Manual
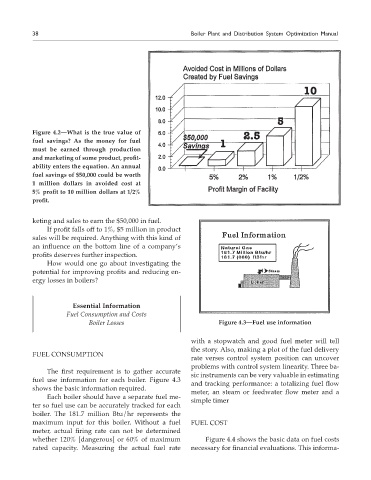
Figure 4.2—What is the true value of
fuel savings? As the money for fuel
must be earned through production
and marketing of some product, profit-
ability enters the equation. An annual
fuel savings of $50,000 could be worth
1 million dollars in avoided cost at
5% profit to 10 million dollars at 1/2%
profit.
keting and sales to earn the $50,000 in fuel.
If profit falls off to 1%, $5 million in product
sales will be required. Anything with this kind of
an influence on the bottom line of a company’s
profits deserves further inspection.
How would one go about investigating the
potential for improving profits and reducing en-
ergy losses in boilers?
Essential Information
Fuel Consumption and Costs
Boiler Losses Figure 4.3—Fuel use information
with a stopwatch and good fuel meter will tell
the story. Also, making a plot of the fuel delivery
FUEL CONSUMPTION
rate verses control system position can uncover
problems with control system linearity. Three ba-
The first requirement is to gather accurate
sic instruments can be very valuable in estimating
fuel use information for each boiler. Figure 4.3
and tracking performance: a totalizing fuel flow
shows the basic information required.
meter, an steam or feedwater flow meter and a
Each boiler should have a separate fuel me-
simple timer
ter so fuel use can be accurately tracked for each
boiler. The 181.7 million Btu/hr represents the
maximum input for this boiler. Without a fuel FUEL COST
meter, actual firing rate can not be determined
whether 120% [dangerous] or 60% of maximum Figure 4.4 shows the basic data on fuel costs
rated capacity. Measuring the actual fuel rate necessary for financial evaluations. This informa-