
Page 58 - Boiler plant and distribution system optimization manual
P. 58
Basic Boiler Plant Efficiency 43
BLOWDOWN HEAT RECOVERY COST OF STEAM
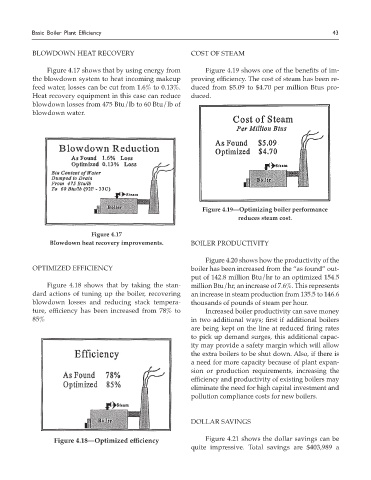
Figure 4.17 shows that by using energy from Figure 4.19 shows one of the benefits of im-
the blowdown system to heat incoming makeup proving efficiency. The cost of steam has been re-
feed water, losses can be cut from 1.6% to 0.13%. duced from $5.09 to $4.70 per million Btus pro-
Heat recovery equipment in this case can reduce duced.
blowdown losses from 475 Btu/lb to 60 Btu/lb of
blowdown water.
Figure 4.19—Optimizing boiler performance
reduces steam cost.
Figure 4.17
Blowdown heat recovery improvements. BOILER PRODUCTIVITY
Figure 4.20 shows how the productivity of the
OPTIMIzED EFFICIENCY boiler has been increased from the “as found” out-
put of 142.8 million Btu/hr to an optimized 154.5
Figure 4.18 shows that by taking the stan- million Btu/hr, an increase of 7.6%. This represents
dard actions of tuning up the boiler, recovering an increase in steam production from 135.5 to 146.6
blowdown losses and reducing stack tempera- thousands of pounds of steam per hour.
ture, efficiency has been increased from 78% to Increased boiler productivity can save money
85% in two additional ways; first if additional boilers
are being kept on the line at reduced firing rates
to pick up demand surges, this additional capac-
ity may provide a safety margin which will allow
the extra boilers to be shut down. Also, if there is
a need for more capacity because of plant expan-
sion or production requirements, increasing the
efficiency and productivity of existing boilers may
eliminate the need for high capital investment and
pollution compliance costs for new boilers.
DOLLAR SAVINGS
Figure 4.18—Optimized efficiency Figure 4.21 shows the dollar savings can be
quite impressive. Total savings are $403,989 a