
Page 390 - Cam Design Handbook
P. 390
THB12 9/19/03 7:34 PM Page 378
378 CAM DESIGN HANDBOOK
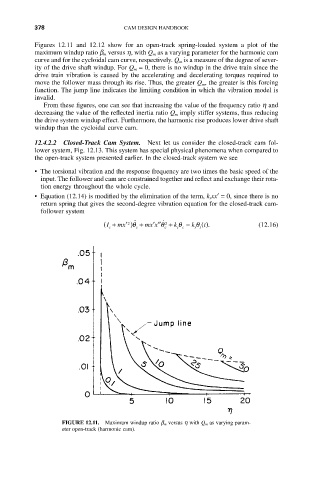
Figures 12.11 and 12.12 show for an open-track spring-loaded system a plot of the
maximum windup ratio b m versus h, with Q m as a varying parameter for the harmonic cam
curve and for the cycloidal cam curve, respectively. Q m is a measure of the degree of sever-
ity of the drive shaft windup. For Q m = 0, there is no windup in the drive train since the
drive train vibration is caused by the accelerating and decelerating torques required to
move the follower mass through its rise. Thus, the greater Q m , the greater is this forcing
function. The jump line indicates the limiting condition in which the vibration model is
invalid.
From these figures, one can see that increasing the value of the frequency ratio h and
decreasing the value of the reflected inertia ratio Q m imply stiffer systems, thus reducing
the drive system windup effect. Furthermore, the harmonic rise produces lower drive shaft
windup than the cycloidal curve cam.
12.4.2.2 Closed-Track Cam System. Next let us consider the closed-track cam fol-
lower system, Fig. 12.13. This system has special physical phenomena when compared to
the open-track system presented earlier. In the closed-track system we see
• The torsional vibration and the response frequency are two times the basic speed of the
input. The follower and cam are constrained together and reflect and exchange their rota-
tion energy throughout the whole cycle.
• Equation (12.14) is modified by the elimination of the term, k r xx¢= 0, since there is no
return spring that gives the second-degree vibration equation for the closed-track cam-
follower system
2 ˙˙
( I + mx¢ )q + mx x ¢¢¢q 2 ˙ + k q = k q t (). (12.16)
c c c s c s i
FIGURE 12.11. Maximum windup ratio b m versus h with Q m as varying param-
eter open-track (harmonic cam).