
Page 528 - Carrahers_Polymer_Chemistry,_Eighth_Edition
P. 528
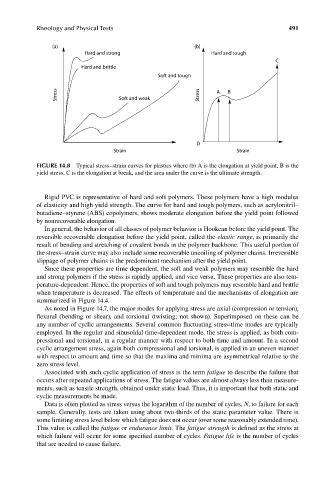
Rheology and Physical Tests                                                  491


                      (a)                                        (b)
                                Hard and strong                       Hard and tough
                                                                                          C
                               Hard and brittle
                                                      Soft and tough

                        Stress            Soft and weak            Stress  A  B


                                                                  D
                                         Strain                               Strain

                 FIGURE 14.8  Typical stress–strain curves for plastics where (b) A is the elongation at yield point, B is the
                 yield stress, C is the elongation at break, and the area under the curve is the ultimate strength.


                    Rigid PVC is representative of hard and soft polymers. These polymers have a high modulus
                 of elasticity and high yield strength. The curve for hard and tough polymers, such as acrylonitril–
                 butadiene–styrene (ABS) copolymers, shows moderate elongation before the yield point followed
                 by nonrecoverable elongation.
                    In general, the behavior of all classes of polymer behavior is Hookean before the yield point. The
                 reversible recoverable elongation before the yield point, called the elastic range, is primarily the
                 result of bending and stretching of covalent bonds in the polymer backbone. This useful portion of
                 the stress–strain curve may also include some recoverable uncoiling of polymer chains. Irreversible
                 slippage of polymer chains is the predominant mechanism after the yield point.
                    Since these properties are time dependent, the soft and weak polymers may resemble the hard
                 and strong polymers if the stress is rapidly applied, and vice versa. These properties are also tem-
                 perature-dependent. Hence, the properties of soft and tough polymers may resemble hard and brittle
                 when temperature is decreased. The effects of temperature and the mechanisms of elongation are
                 summarized in Figure 14.4.
                    As noted in Figure 14.7, the major modes for applying stress are axial (compression or tension),
                 flexural (bending or shear), and torsional (twisting; not shown). Superimposed on these can be


                 any number of cyclic arrangements. Several common fluctuating stress-time modes are typically
                 employed. In the regular and sinusoidal time-dependent mode, the stress is applied, as both com-
                 pressional and torsional, in a regular manner with respect to both time and amount. In a second
                 cyclic arrangement stress, again both compressional and torsional, is applied in an uneven manner
                 with respect to amount and time so that the maxima and minima are asymmetrical relative to the
                 zero stress level.
                    Associated with such cyclic application of stress is the term fatigue to describe the failure that
                 occurs after repeated applications of stress. The fatigue values are almost always less than measure-
                 ments, such as tensile strength, obtained under static load. Thus, it is important that both static and
                 cyclic measurements be made.
                    Data is often plotted as stress versus the logarithm of the number of cycles, N, to failure for each
                 sample. Generally, tests are taken using about two-thirds of the static parameter value. There is
                 some limiting stress level below which fatigue does not occur (over some reasonably extended time).

                 This value is called the fatigue or endurance limit. The fatigue strength is defined as the stress at
                 which failure will occur for some specified number of cycles. Fatigue life is the number of cycles

                 that are needed to cause failure.


                                                                                              9/14/2010   3:42:35 PM
         K10478.indb   491                                                                    9/14/2010   3:42:35 PM
         K10478.indb   491