
Page 529 - Carrahers_Polymer_Chemistry,_Eighth_Edition
P. 529
492 Carraher’s Polymer Chemistry
4°C
20°C
Stress 40°C
50°C
60°C
Strain
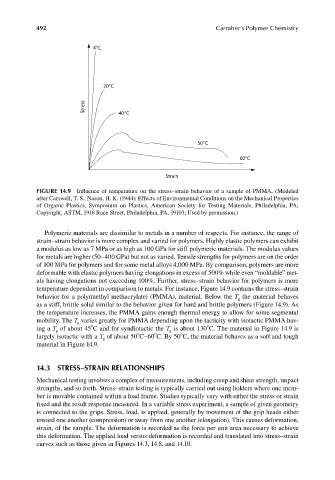
FIGURE 14.9 Influence of temperature on the stress–strain behavior of a sample of PMMA. (Modeled
after Carswell, T. S., Nason, H. K. (1944): Effects of Environmental Conditions on the Mechanical Properties
of Organic Plastics, Symposium on Plastics, American Society for Testing Materials, Philadelphia, PA;
Copyright, ASTM, 1916 Race Street, Philadelphia, PA, 19103; Used by permission.)
Polymeric materials are dissimilar to metals in a number of respects. For instance, the range of
strain–strain behavior is more complex and varied for polymers. Highly elastic polymers can exhibit
a modulus as low as 7 MPa or as high as 100 GPa for stiff polymeric materials. The modulus values
for metals are higher (50–400 GPa) but not as varied. Tensile strengths for polymers are on the order
of 100 MPa for polymers and for some metal alloys 4,000 MPa. By comparison, polymers are more
deformable with elastic polymers having elongations in excess of 500% while even “moldable” met-
als having elongations not exceeding 100%. Further, stress–strain behavior for polymers is more
temperature dependant in comparison to metals. For instance, Figure 14.9 contains the stress–strain
behavior for a poly(methyl methacrylate) (PMMA), material. Below the T the material behaves
g
as a stiff, brittle solid similar to the behavior given for hard and brittle polymers (Figure 14.9). As
the temperature increases, the PMMA gains enough thermal energy to allow for some segmental
mobility. The T varies greatly for PMMA depending upon the tacticity with isotactic PMMA hav-
g
o
o
ing a T of about 45 C and for syndiotactic the T is about 130 C. The material in Figure 14.9 is
g
g
o
o
o
largely isotactic with a T of about 50 C–60 C. By 50 C, the material behaves as a soft and tough
g
material in Figure 14.9.
14.3 STRESS–STRAIN RELATIONSHIPS
Mechanical testing involves a complex of measurements, including creep and shear strength, impact
strengths, and so forth. Stress–strain testing is typically carried out using holders where one mem-
ber is movable contained within a load frame. Studies typically vary with either the stress or strain
fixed and the result response measured. In a variable stress experiment, a sample of given geometry
is connected to the grips. Stress, load, is applied, generally by movement of the grip heads either
toward one another (compression) or away from one another (elongation). This causes deformation,
strain, of the sample. The deformation is recorded as the force per unit area necessary to achieve
this deformation. The applied load versus deformation is recorded and translated into stress–strain
curves such as those given in Figures 14.3, 14.8, and 14.10.
9/14/2010 3:42:36 PM
K10478.indb 492 9/14/2010 3:42:36 PM
K10478.indb 492