
Page 269 - Chiral Separation Techniques
P. 269
9.6 Operation of the SMB Unit 247
*F
F
*F
F
where ∆q /∆C is the slope of the chord linking points (C , q ) and (0,0) with
A A A A
C = 0. Considering that the feed concentration used is 5 g/L –1 of each species
B
F
*F
and ∆ q /∆C = 1.35 + 7.32 × 0.087/(1 + 0.087 × 5) = 1.794, Equation (35) gives
A
A
–1
*
Q = 23.51 mL min .
IV
Following the procedure presented earlier, the γ values for sections I and IV
were fixed, in such a way that constraints concerning these zones were fulfilled:
γ = 3.8657 and γ = 2.6901. Since the liquid flow rates in sections I and IV are constants
I IV
–1
*
in this study, the eluent flow rate is also constant and equal to Q – Q = 7.49 mL min .
I IV
The original optimization problem with five variables was, by choosing the liquid
flow rate in section I by pressure-drop limitations and following Equations (35) and
(36) to evaluate the switch time interval and the recycling flow rate, reduced to a
two-variable optimization problem: the choice of liquid flow rates in the two central
sections. Table 9-5 summarizes the SMB operating conditions (and equivalent TMB
conditions) used in the design of the γ –γ plot.
III II
Table 9-5. Operating conditions and model parameters for the γ – γ plot.
III
II
SMB: Equivalent TMB:
Column diameter: D = 2.6 cm
c
Column length: L = 9.9 cm Section length: L = 2 L = 19.8 cm
c j c
Configuration: 2-2-2-2
Bed porosity: ε = 0.4
Peclet number: Pe = 1000 Peclet number: Pe = 2 Pe = 2000
j
–1
Feed concentration: 5.0 g L each
Switch time interval: Solid flow rate:
*
*
t = 3.3 min Q = (1 – ε) V /t = 9.56 mL min –1
s c
Flow rate in section I:
*
*
Q = 31 mL min –1 Q = Q – Q ε/(1 – ε) = 24.63 mL min –1
I I I s
γ = 3.8657
I
Flow rate in section IV:
*
Q * IV = 23.51 mL min –1 Q = Q – Q ε/(1 – ε) = 17.14 mL min –1
IV
s
IV
γ = 2.6901
IV
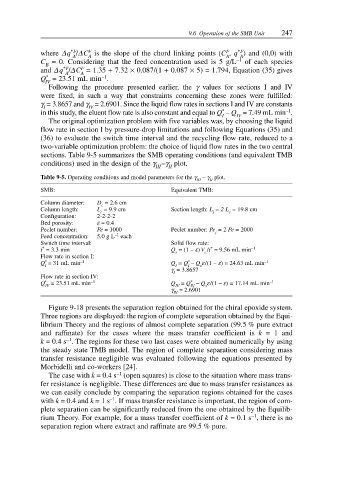
Figure 9-18 presents the separation region obtained for the chiral epoxide system.
Three regions are displayed: the region of complete separation obtained by the Equi-
librium Theory and the regions of almost complete separation (99.5 % pure extract
and raffinate) for the cases where the mass transfer coefficient is k = 1 and
–1
k = 0.4 s . The regions for these two last cases were obtained numerically by using
the steady state TMB model. The region of complete separation considering mass
transfer resistance negligible was evaluated following the equations presented by
Morbidelli and co-workers [24].
–1
The case with k = 0.4 s (open squares) is close to the situation where mass trans-
fer resistance is negligible. These differences are due to mass transfer resistances as
we can easily conclude by comparing the separation regions obtained for the cases
–1
with k = 0.4 and k = 1 s . If mass transfer resistance is important, the region of com-
plete separation can be significantly reduced from the one obtained by the Equilib-
–1
rium Theory. For example, for a mass transfer coefficient of k = 0.1 s , there is no
separation region where extract and raffinate are 99.5 % pure.